Knowledge Centre · Cost & returns

What does commercial solar cost in South Africa?

Commercial rooftop solar in South Africa generally pays for itself in three to five years. Across Focal Energy’s 17 published installations, from 40 kWp to 778 kWp, modelled simple payback runs from 3 to 5 years and modelled IRR from 19% to 38%, against blended tariffs of R1.88 to R2.20 per kWh. Published market guidance puts installed cost at roughly R12,000 to R18,000 per kW in 2026 — but price per kW is the least useful number in the conversation. What decides the return is the tariff the system displaces and how much of its output the site actually consumes.

By Jonathan de Vrye, BSc EngManaging Director, Focal Energy · Updated 4 August 2026 · Figures marked as modelled are design-stage projections, labelled as such on each case study.

What is the going rate for a commercial system?

Published market guidance for South African commercial installations in 2026 sits at roughly R12,000 to R18,000 per kW installed, before battery storage. The bands below follow that guidance by system size.

System sizeIndicative installed costWhat moves it
20–50 kWpR400,000 – R900,000Fixed costs — design, sign-offs, registration, access — spread over few kilowatts, so the rate per kW sits at the top of the range.
50–150 kWpR900,000 – R2,500,000The band where most single-tenant commercial roofs land. Scale starts to work in your favour.
150 kWp and aboveR2,500,000 upwardsRates trend toward the lower end per kW, but grid connection, MV work and structural strengthening become the swing factors.

These are published market ranges, not a Focal Energy quote and not a price list. Every roof carries its own structural, access and grid-connection conditions, which is exactly why the ranges are as wide as they are.

What is actually in the price?

A complete commercial installation is roughly a third equipment and two thirds engineering, labour, compliance and connection. When quotes diverge, it is almost never the modules — it is which of the items below a bidder has left out.

Modules, inverters, mounting

The visible plant, and usually the smallest source of price variance between serious quotes. Module prices are commodity-driven; the mounting system is where roof-specific engineering starts.

DC and AC reticulation

String cabling, combiner boxes, AC cabling to the point of connection, protection devices, isolators and labelling. Priced by distance and by volt-drop limits, not by system size — a plant room 200 m from the array costs materially more than one below the array.

Structural engineering sign-off

A professional assessment that the roof carries the additional dead and wind load. On older sheeting or long-span purlins this can trigger reinforcement, which is a genuine cost and a genuine reason a cheap quote is cheap.

Electrical professional engineer sign-off

Design certification by a registered professional — required for the supply authority's embedded-generation application and for insurers.

Certificate of Compliance (COC)

The installation certificate under the national wiring code. Without it the installation is not legally compliant and an insurer has grounds to decline.

Lightning risk assessment

A rooftop array is an extended metallic structure on a Highveld roof. The assessment determines earthing and surge protection — cheap to do, expensive to skip.

Embedded-generation registration

The application to the supply authority, with single-line diagrams, approved-equipment evidence and grid protection settings. Often a meter change too.

Monitoring and metering

Inverter-level monitoring at minimum. Independent check metering — a meter that is not the inverter's own — is what makes performance claims auditable rather than self-reported.

Commissioning and handover

Testing, protection-setting verification, as-built documentation, warranties and operating instructions. The paperwork is what a future buyer, bank or insurer will ask for.

Why do two quotes for the same roof differ by 30–50%?

Because they are usually not quoting the same scope. The factors below move a commercial solar price far more than the choice of module brand, and most of them are invisible from a satellite photograph.

FactorCostWhy
Battery storageThe single largest swing item. Storage can cost more than the entire PV plant it supports, and it is the usual explanation when two quotes differ by half.
Roof condition and ageSheeting near the end of its life should be replaced before a 25-year asset is bolted to it. Doing it afterwards means dismantling the array.
Structural strengtheningWhere the engineer requires purlin or truss reinforcement. Common on older industrial sheds and almost always omitted from the cheapest quote.
Height, access and edge protectionScaffolding, mobile platforms, fall arrest and crane time are labour costs that scale with the building, not with the kilowatts.
Distance to the point of connectionCopper is priced by the metre and volt-drop limits force a larger cross-section over distance. A long run can cost more than a string of modules.
Existing switchgear and boardsOlder distribution boards frequently need replacement or upgrade before a generation source can be connected safely.
MV rather than LV connectionConnecting at medium voltage brings switchgear, protection and metering of a different order to an LV tie-in.
Export limiting or zero exportA controller and metering to hold generation behind the meter. Modest in cost, and often the condition of approval.
System sizeDesign, sign-offs, registration and mobilisation are largely fixed. Spreading them over more kilowatts is the main reason large systems cost less per kW.
DC:AC ratio±Oversizing the array relative to the inverters lifts morning and afternoon output cheaply, at the cost of clipping the summer midday peak. The right ratio depends on the load profile, not on a rule of thumb.
Module and inverter tier±Equipment choice moves price less than most buyers expect. What it moves is warranty terms, degradation rates and whether the manufacturer will still exist to honour either.
Operations and maintenance±Not capital cost but lifetime cost. Cleaning, inverter servicing, monitoring, reporting and eventual inverter replacement belong in the model, not in a footnote.

The practical defence is to issue one scope of works to every bidder and require the same line items back. Quotes that looked 50% apart usually land within 15% of each other once they are describing the same job.

What returns do commercial systems actually achieve?

Below is every installation Focal Energy publishes a case study for — system size, year-one production, the blended tariff the generation displaces, and the modelled simple payback and IRR. Nothing is withheld and nothing is a best case: the range runs from 19% to 38%, and the difference between the two ends is mostly the tariff, not the engineering.

InstallationSizeYear 1TariffSavingsPaybackIRR
Hermanstad Industrial ParkIndustrial · Pretoria778 kWp1,245 MWhR1.88R2.34M4 yrs28%
Kimbult Industrial ParkIndustrial · Johannesburg547 kWp699 MWhR1.99R1.54M3.2 yrs35%
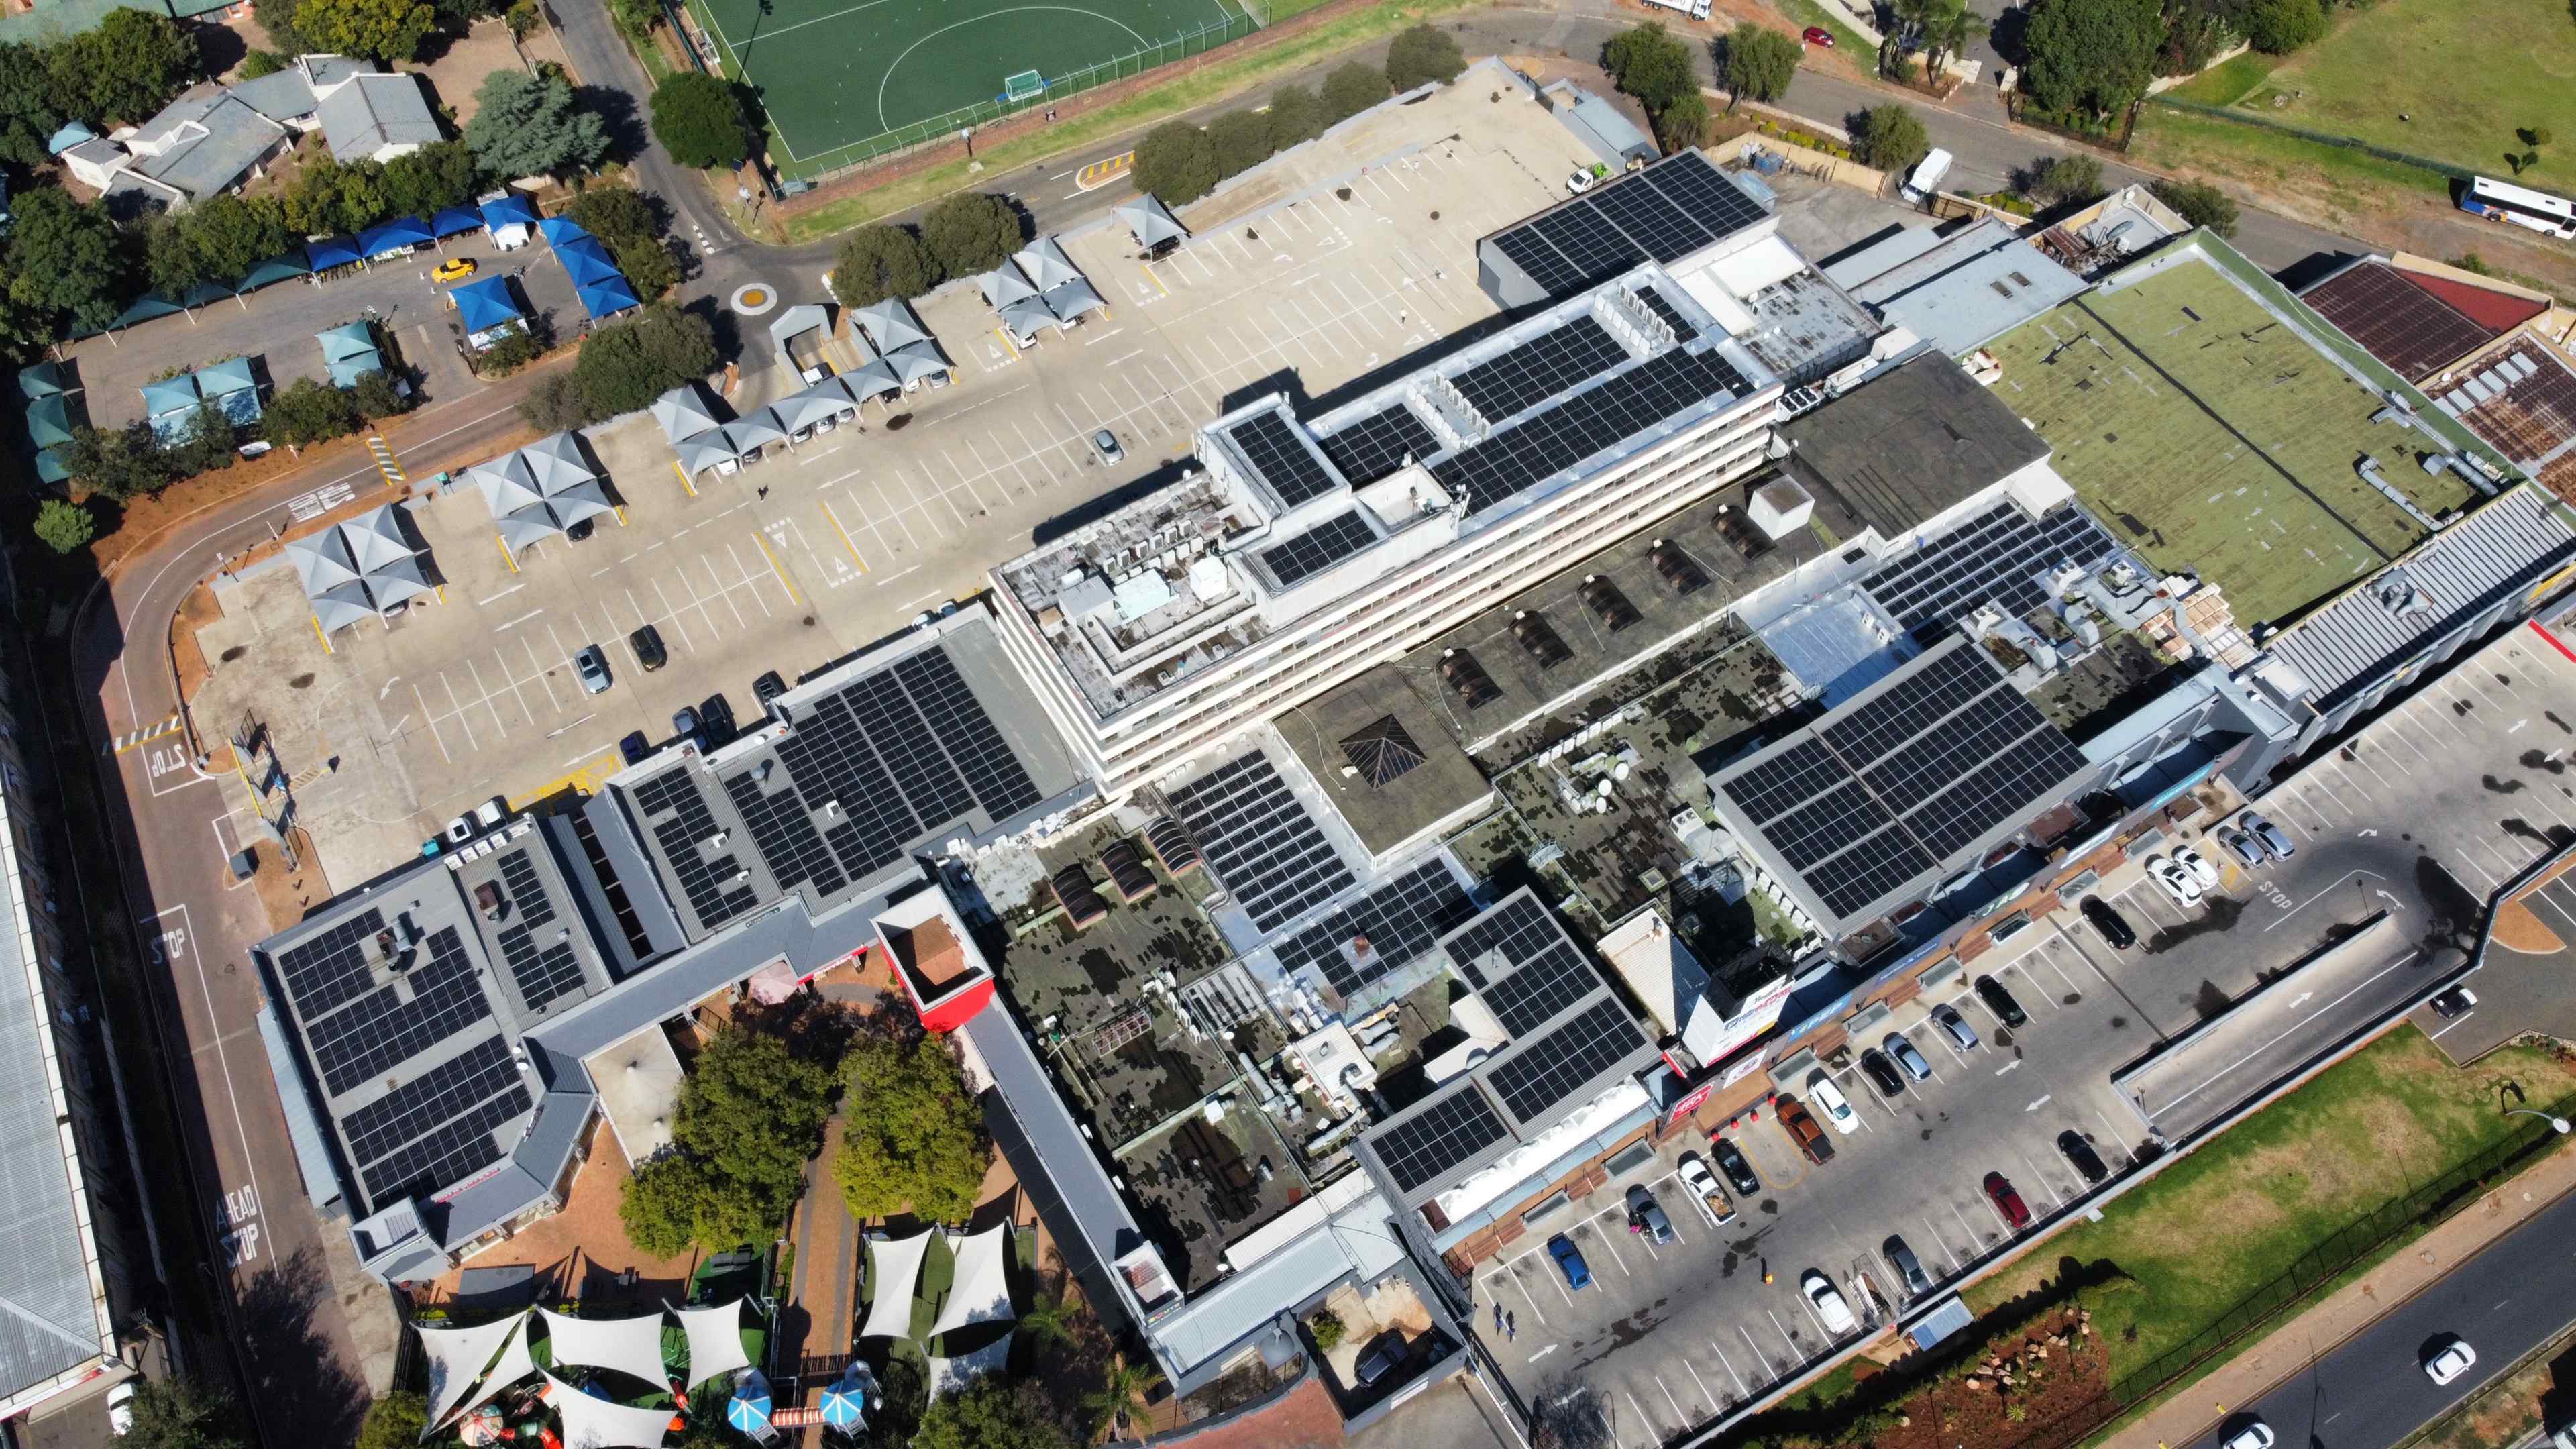
Heathway Shopping CentreRetail · Johannesburg492 kWp712 MWhR1.88R1.58M3 yrs38%
Terrazzo Shopping CentreRetail · Johannesburg285 kWp456 MWhR1.88R857k4 yrs30%
TFG ManufacturingIndustrial · Cape Town255 kWp408 MWhR1.88R767k4 yrs26%
Skyway Business Park - Section 1Commercial · Johannesburg164 kWp238 MWhR2.16R411k3.4 yrs34%
Hillcrest Retail CentreRetail · Johannesburg145 kWp232 MWhR2.20R510k5 yrs22%
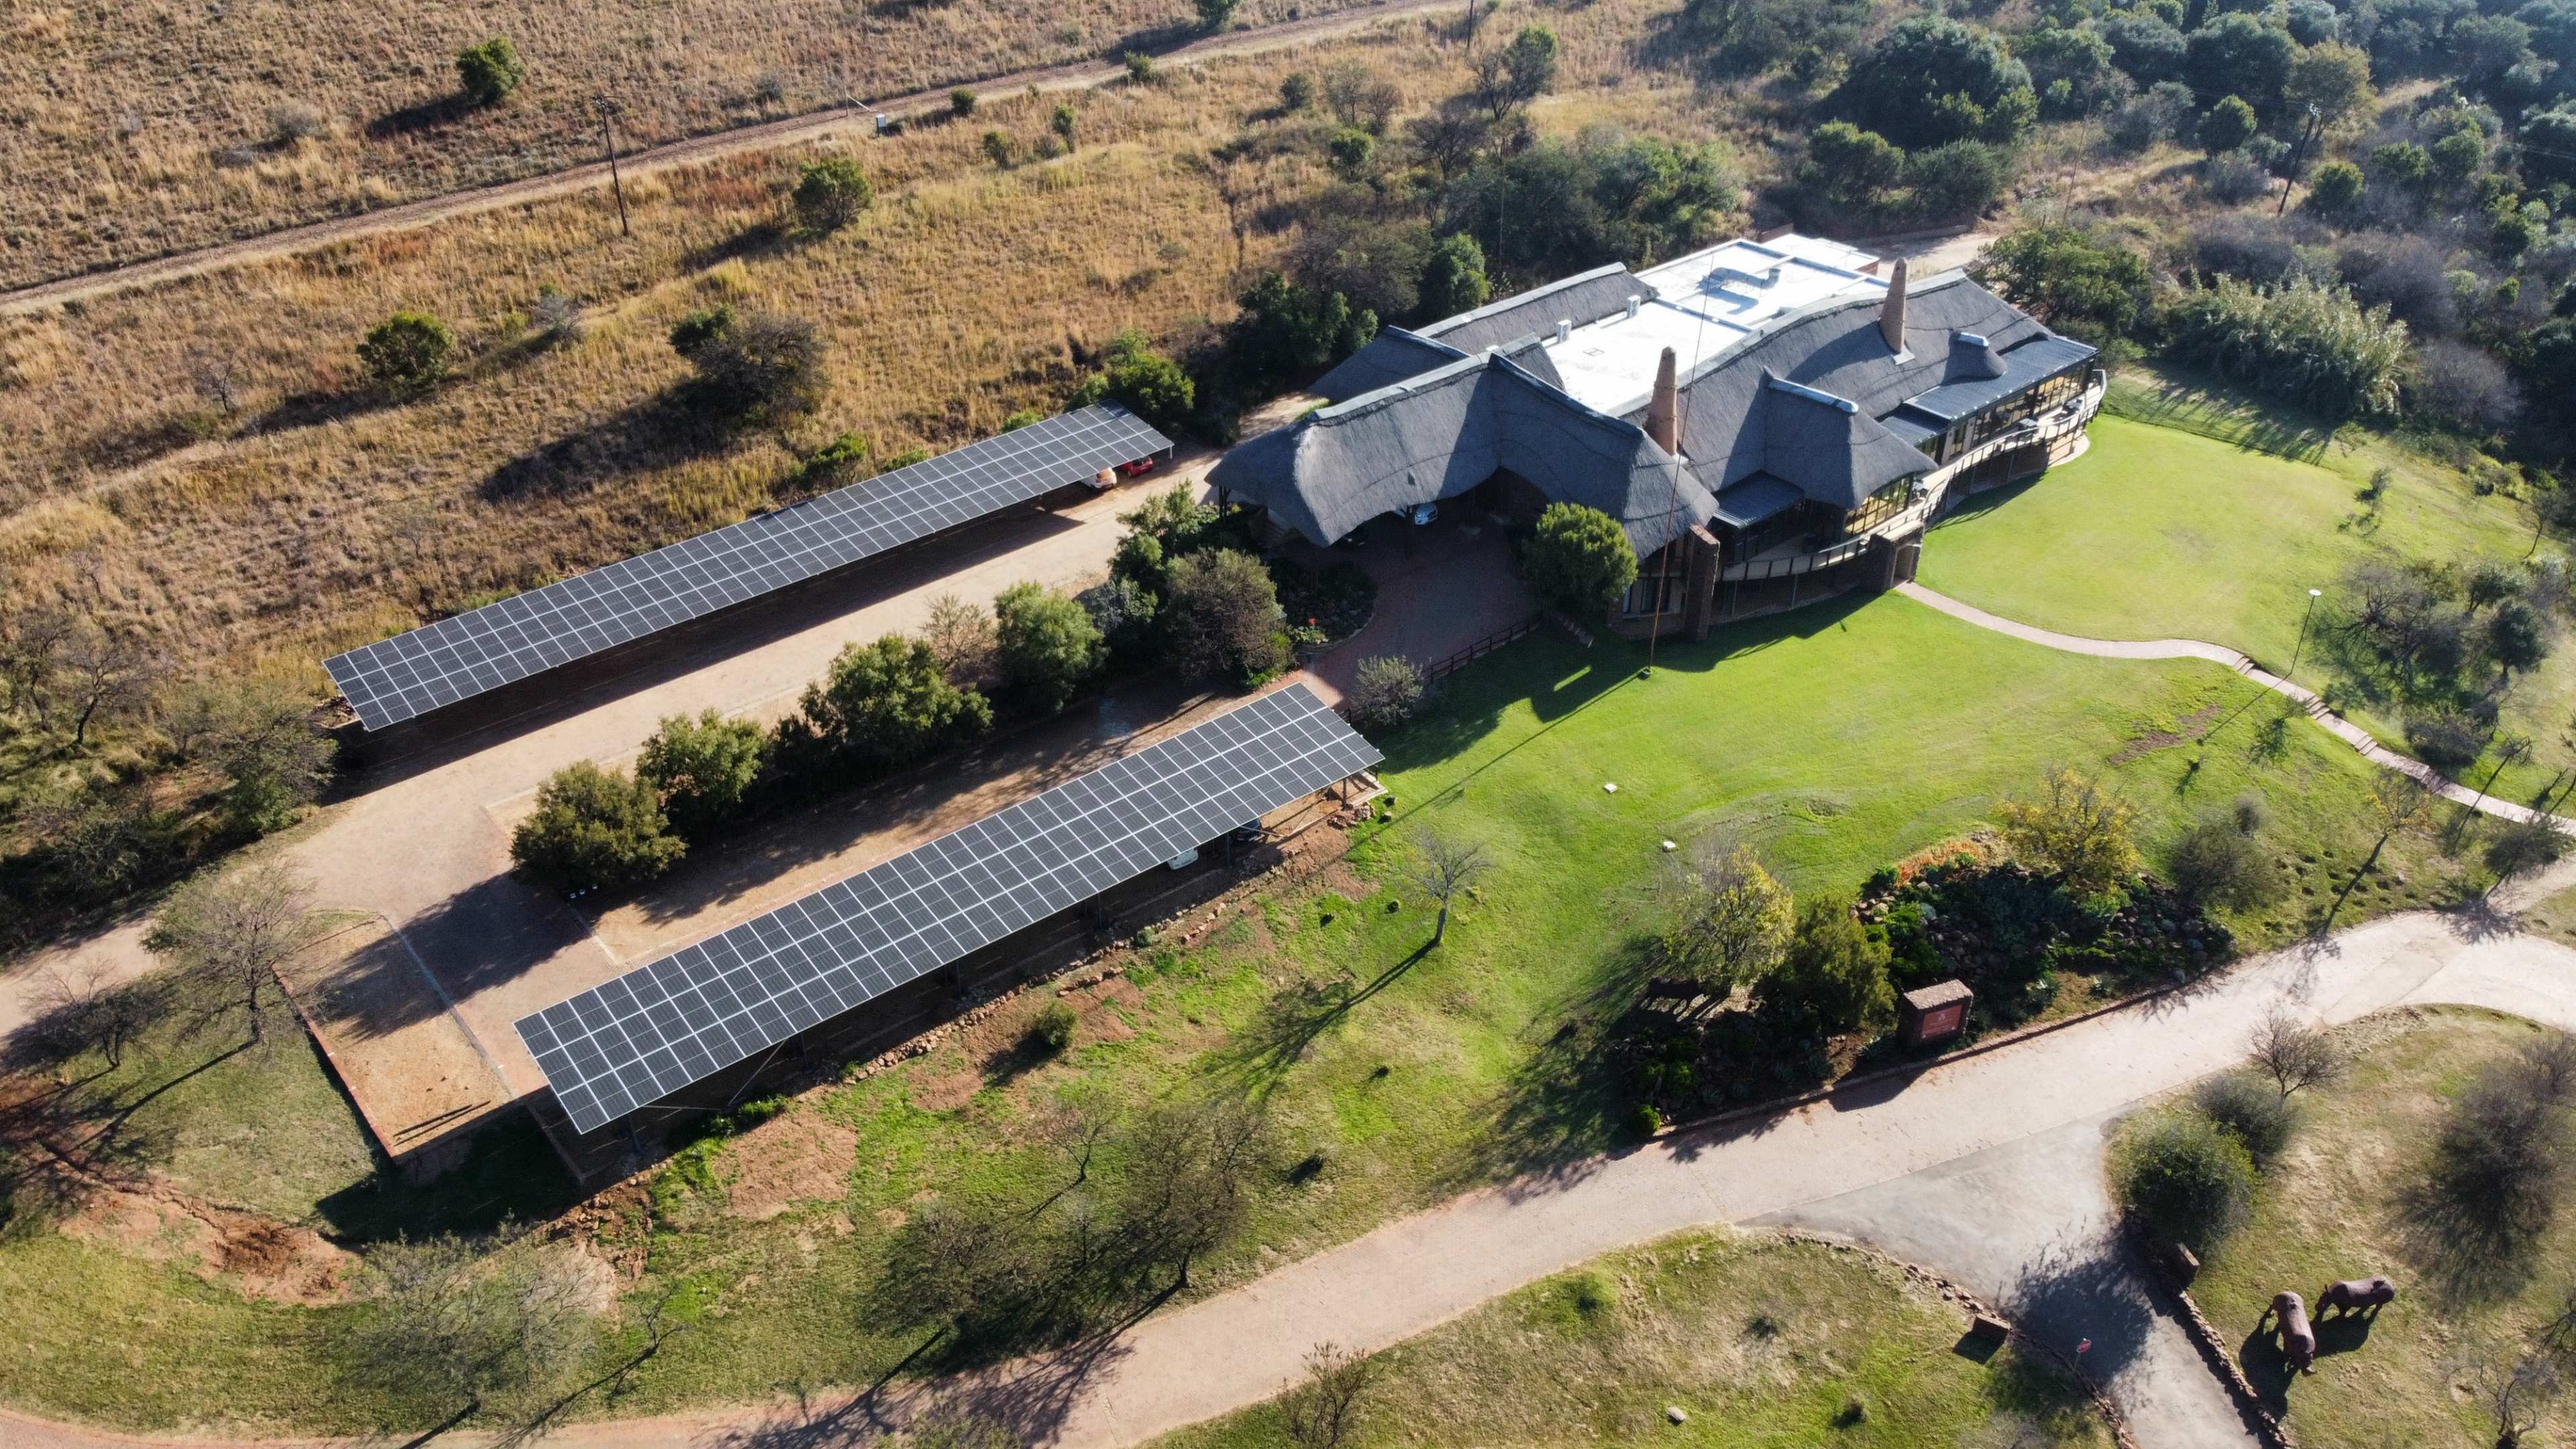
African Hills Safari LodgeHospitality · Magaliesburg140 kWp224 MWhR2.20R493k5 yrs22%
Canero Office ParkCommercial · Johannesburg124 kWp198 MWhR2.20R436k5 yrs22%
5 Star Business ParkCommercial · Johannesburg124 kWp198 MWhR2.20R436k5 yrs22%
Kya Rock CentreCommercial · Johannesburg102 kWp163 MWhR2.20R359k5 yrs20%
North Riding Commercial ParkCommercial · Johannesburg99 kWp153 MWhR2.17R308k3.5 yrs33%
Skyway Business Park - Section 2Commercial · Johannesburg68 kWp100 MWhR2.16R172k3.4 yrs34%
Meadowbrook Business ParkCommercial · Johannesburg53 kWp85 MWhR2.20R187k5 yrs20%
Meadowbrook Office ParkOffice · Johannesburg50 kWp80 MWhR2.20R176k5 yrs19%
Campora Business ParkCommercial · Johannesburg44 kWp70 MWhR2.20R154k5 yrs20%
Manhattan Street IndustrialIndustrial · Cape Town40 kWp64 MWhR2.20R141k5 yrs19%

How these figures were produced

Every figure above is a design-stage projection: production is the estimated year-one yield, savings the year-one projection valued at that site’s blended tariff as modelled, and payback is simple payback. They are published as modelled rather than restated, so nothing here has been quietly improved after the fact — tariff escalation since then moves all of them in the owner’s favour.

Marked rows were modelled on standard commercial tariff assumptions rather than that site’s own tariff data, which is why they share a payback and a blended rate. They are marked so the distinction is visible rather than buried, and they will be refreshed with site-specific figures.

Focal Energy monitors the installations it operates. As that reporting comes online, these projections will be replaced with measured production and each site’s live blended tariff, and the distinction will stay marked on the page. A projection presented as a measurement is the most common way performance claims mislead, and it is not something we intend to do quietly.

How should a payback number be read?

A payback figure is only as good as the four assumptions under it, and none of them are visible in the number itself.

  • Simple or discounted?

    Simple payback divides capital cost by year-one savings and ignores everything afterwards. It is the friendlier of the two and the one most often quoted.

  • Valued at which rate?

    Savings valued against a peak rate look far better than the same savings valued against a blended tariff. Only the blended figure reflects what a year of generation is genuinely worth.

  • What escalation?

    A model assuming aggressive tariff escalation will show a shorter payback. Ask what rate was used and whether it is defensible.

  • What was left out?

    Degradation, cleaning, inverter servicing and eventual inverter replacement all lengthen payback. A model without them is not wrong, it is incomplete.

Two honest engineers can quote paybacks a year apart off the same roof purely on assumptions. The definitions behind each of these sit in the glossary, alongside IRR and LCOE, which is the fairer basis for comparing an owned system against a PPA offer.

What does battery storage add to the cost?

Storage is the single largest variable in a commercial energy budget, and it is usually the explanation when one quote is half another. It should be justified on what it is being asked to do, not added by default.

Where a site carries a demand charge and its highest half-hour falls outside generation hours — a winter morning start-up, for instance — solar alone cannot touch it, and storage sized to shift that peak can carry its own cost. Where the objective is continuity through an outage, the case is operational rather than financial and should be argued that way. What does not work is sizing storage without interval meter data: the half-hourly load profile is what tells you how many kilowatt-hours you need and for how long.

Does the tax allowance change the maths?

Materially, yes. South Africa’s capital allowance for renewable generation assets accelerates depreciation, which can lift an after-tax IRR well above the pre-tax figure a proposal shows.

The rules and rates change with the national budget, so the treatment for a specific business in a specific tax year belongs with a tax adviser rather than a proposal PDF. The point for budgeting is simply that the pre-tax payback on a quote is usually the conservative figure, not the optimistic one.

What if the capital isn’t available?

Then the question changes from “what does it cost” to “what does the energy cost”, which is the more useful question anyway.

Under a power purchase agreement, the system is funded and owned by the provider and the business buys the generation at an agreed rate per kWh — no upfront capital, and asset performance risk sits with the owner rather than the tenant of the roof. Co-investment structures sit between that and outright purchase. The comparison that matters is the same in every case: the rate per kWh you end up paying, against the tariff it displaces, over the life of the asset.

Focal Energy’s funding options cover outright purchase, PPA with no upfront capital, and co-investment.

Common questions

What does commercial solar cost per kW in South Africa?

Published 2026 market guidance for South African commercial installations clusters roughly between R12,000 and R18,000 per kW installed, with larger systems trending toward the lower end and battery storage pushing above it. Treat that as the shape of the market rather than a quote: the same building can attract honest quotes 30–50% apart depending on roof condition, structural work, distance to the point of connection and whether storage is included.

How long does commercial solar take to pay for itself in South Africa?

Three to five years is the usual range for a commercial rooftop system sized to on-site consumption. Across Focal Energy's 17 published case studies, from 40 kWp to 778 kWp, modelled simple payback runs from 3 to 5 years and modelled IRR from 19% to 38%. The determining factor is the tariff being displaced and how much of the generation is consumed on site, not the price per kW.

Why are solar quotes for the same building so different?

Usually because they are not quoting the same scope. The common omissions are structural reinforcement, roof replacement where the sheeting is near end of life, cabling to a distant point of connection, switchgear upgrades, embedded-generation registration and the professional sign-offs. Ask every bidder for the same line items and the spread narrows sharply.

Is it cheaper to buy a commercial solar system or sign a PPA?

Buying gives the lowest lifetime cost per kWh because there is no financing margin, but it consumes capital and puts asset performance risk on the business. A power purchase agreement requires no upfront capital and shifts performance risk to the provider, at a higher cost per kWh. The right comparison is the PPA rate against the levelised cost of the owned system, both measured against the tariff they displace — not the monthly payment against nothing.

Does a commercial solar system need approval before it can operate?

Yes. A grid-tied commercial system must be registered as small-scale embedded generation with its supply authority before it may run, supported by a single-line diagram signed by a professional engineer, equipment from the authority's approved list, and a Certificate of Compliance for the installation. Requirements and capacity thresholds differ between authorities and change, so they should be confirmed for the specific connection.

Do batteries make financial sense on a commercial site?

It depends on what the battery is being asked to do. Where the site carries a demand charge and its peak falls outside generation hours, storage that shifts that peak can pay for itself. Where the objective is backup during outages, the value is continuity of operations rather than energy savings, and it should be justified on that basis. Storage sized without interval meter data is usually sized wrong.

What ongoing costs follow a commercial solar installation?

Budget for module cleaning at a frequency set by the site's soiling rate, inverter servicing, monitoring and performance reporting, insurance, and inverter replacement once within a 25-year life. These are modest against the energy saved but they are not zero, and a payback figure calculated without them is optimistic by construction.

See what your site could save.

Tell us your monthly electricity usage and we'll model your consumption, system options and payback — numbers you can put in front of a board.