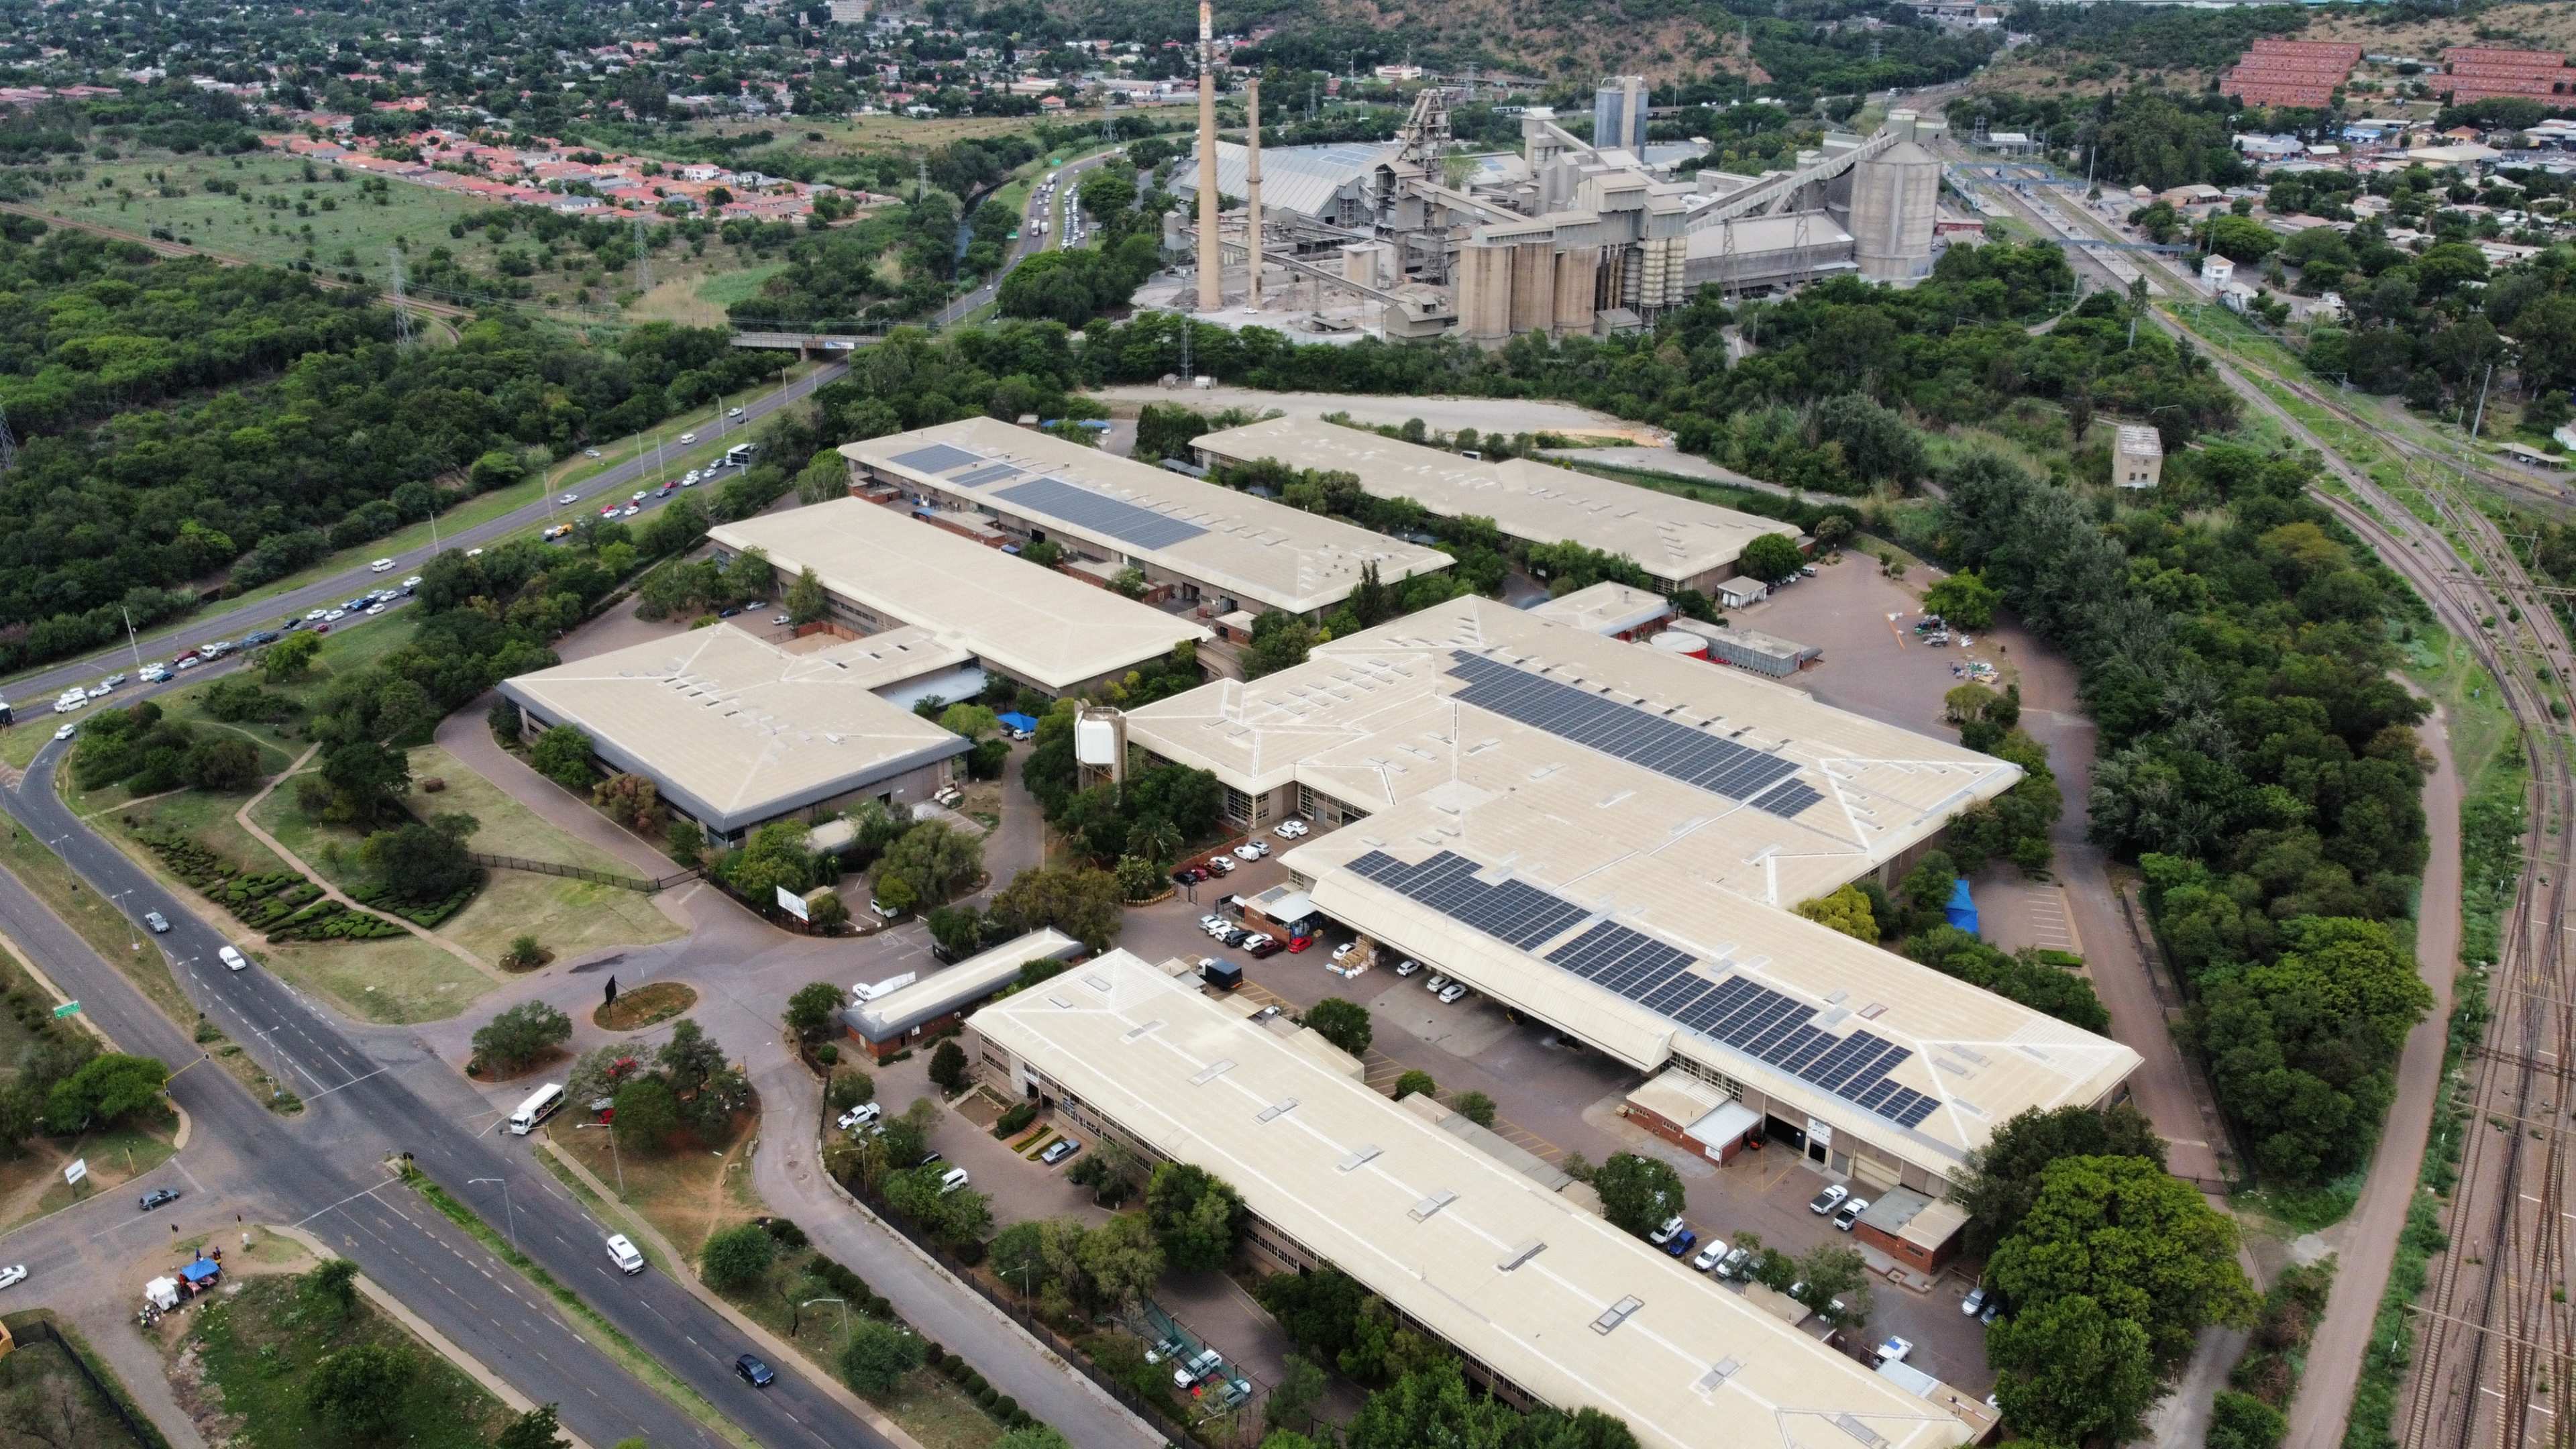
Knowledge Centre · Tariff reference

Tshwane electricity tariffs 2026/27: what businesses pay

The City of Tshwane raised every line of its tariff book by 8.80% on 1 July 2026, and bills businesses on one of three main tariffs. Most of the bill is energy and demand, metered by the half hour, and the daytime part is exactly what a solar system removes at full rate. All rates below exclude VAT.

By Jonathan de Vrye, BSc EngManaging Director, Focal Energy · Updated 31 August 2026 · All rates exclude VAT.

Which tariff is your business on?

This page covers the three main tariffs that apply to businesses in the City of Tshwane, from Pretoria and Centurion to the Rosslyn industrial belt and the wider metro. Residential tariffs, resellers, agricultural scales and the 132 kV class are out of scope, and so are sites that buy directly from Eskom (the name on your electricity invoice tells you which you are). The supply voltage and average load decide the tariff, and the tariff decides what solar can and cannot save. At a glance:

2026/27, ex VAT1. Small business2. LV time-of-use3. 11 kV time-of-use
Applies toUp to 150 AAvg load above 50 kVA,
breaker up to 800 A
Supplied at 11 kV
(avg load above 200 kVA)
Summer (Sep–May)Off-peakR3.24/kWhR1.31/kWhR1.19/kWh
StandardR1.85/kWhR1.69/kWh
PeakR2.87/kWhR2.67/kWh
Winter (Jun–Aug)Off-peakR3.24/kWhR1.57/kWhR1.38/kWh
StandardR2.74/kWhR2.60/kWh
PeakR6.99/kWhR6.97/kWh
Demand chargeNoneR373.21/kVAR370.66/kVA
Fixed chargesR2,090.73R20,799.37/m
by phases and amperage
R19,055.98/mR27,226.11/m†

Rates rounded to cents; exact figures in the tariff tables below. †The 11 kV fixed charge is levied per metering point: a site with two metering points pays it twice. Non-time-of-use variants of the demand scales also exist (flat energy R2.4887/kWh at LV, R2.3445/kWh at 11 kV).

1. Small business (up to 150 A)

The non-domestic conventional and prepaid scales: single-phase or three-phase connections up to 150 A. Energy is one flat rate all year, with no seasons and no time-of-use; the fixed monthly charge is set by the number of phases and the amperage band, and it is substantial.

2026/27 (ex VAT)Rate
Energy, single-phase (all year)R3.2339/kWh
Energy, three-phase (all year)R3.2361/kWh
Fixed charge, 1-phase up to 60 AR2,090.73/month
Fixed charge, 1-phase 61–80 AR2,740.40/month
Fixed charge, 3-phase up to 60 AR6,369.91/month
Fixed charge, 3-phase 126–150 AR20,799.37/month

Intermediate three-phase amperage bands (61–125 A) carry fixed charges between the two shown. Prepaid variants run slightly lower fixed charges at the same energy rate.

Solar on this tariff: every self-consumed solar kWh avoids the flat rate of about R3.24, day in, day out, with no seasonal or hourly complexity: the simplest solar arithmetic in Gauteng. The fixed charge remains whatever you do, which is an argument for right-sizing the connection, not against solar.

2. Low-voltage time-of-use demand scale

For three-phase low-voltage premises with an annual average metered load above 50 kVA (a breaker larger than 80 A, up to 800 A). Energy is time-of-use by season and period, plus a demand charge on the half-hourly maximum in any period, plus a fixed monthly charge.

Energy (ex VAT)Summer (Sep–May)Winter (Jun–Aug)
PeakR2.8673/kWhR6.9919/kWh
StandardR1.8526/kWhR2.7431/kWh
Off-peakR1.3092/kWhR1.5705/kWh
Demand charge (all periods, min 30 kVA)R373.21/kVA/month
Fixed chargeR19,055.98/month

How demand is billed on this tariff. The half-hourly maximum of the month, in any period including off-peak, with a minimum billed demand of 30 kVA. When readings are unavailable, the city bills 60% of the highest demand of the preceding three months. There is no standing floor like City Power’s 80%-of-history rule: with working metering, a quiet month is billed on its own maximum.

Solar on this tariff: generation lands in the standard and peak daytime windows, so each solar kWh displaces energy priced well above the small-business flat rate, up to R6.9919 in the winter peak. The winter morning peak starts at 06:00, before solar wakes, and demand bills in all periods, so the demand line needs storage and load management, not panels alone. Detail in the solar section below.

3. 11 kV time-of-use scale

For premises supplied at 11 kV (the 11 kV scales serve average loads above 200 kVA). The structure matches the LV scale at lower energy rates, with two differences that matter: the fixed charge is levied per metering point, and the minimum billed demand is 140 kVA.

Energy (ex VAT)Summer (Sep–May)Winter (Jun–Aug)
PeakR2.6696/kWhR6.9684/kWh
StandardR1.6901/kWhR2.6037/kWh
Off-peakR1.1917/kWhR1.3823/kWh
Demand charge (all periods, min 140 kVA)R370.66/kVA/month
Fixed charge, per metering pointR27,226.11/month

How demand is billed on this tariff. As on the LV scale: the month’s own half-hourly maximum in any period, floored at 140 kVA, with a readings-unavailable fallback of 70% of the highest of the preceding three months. A site whose peaks sit below 140 kVA pays the floor regardless, which makes right-sizing the supply agreement part of the energy conversation.

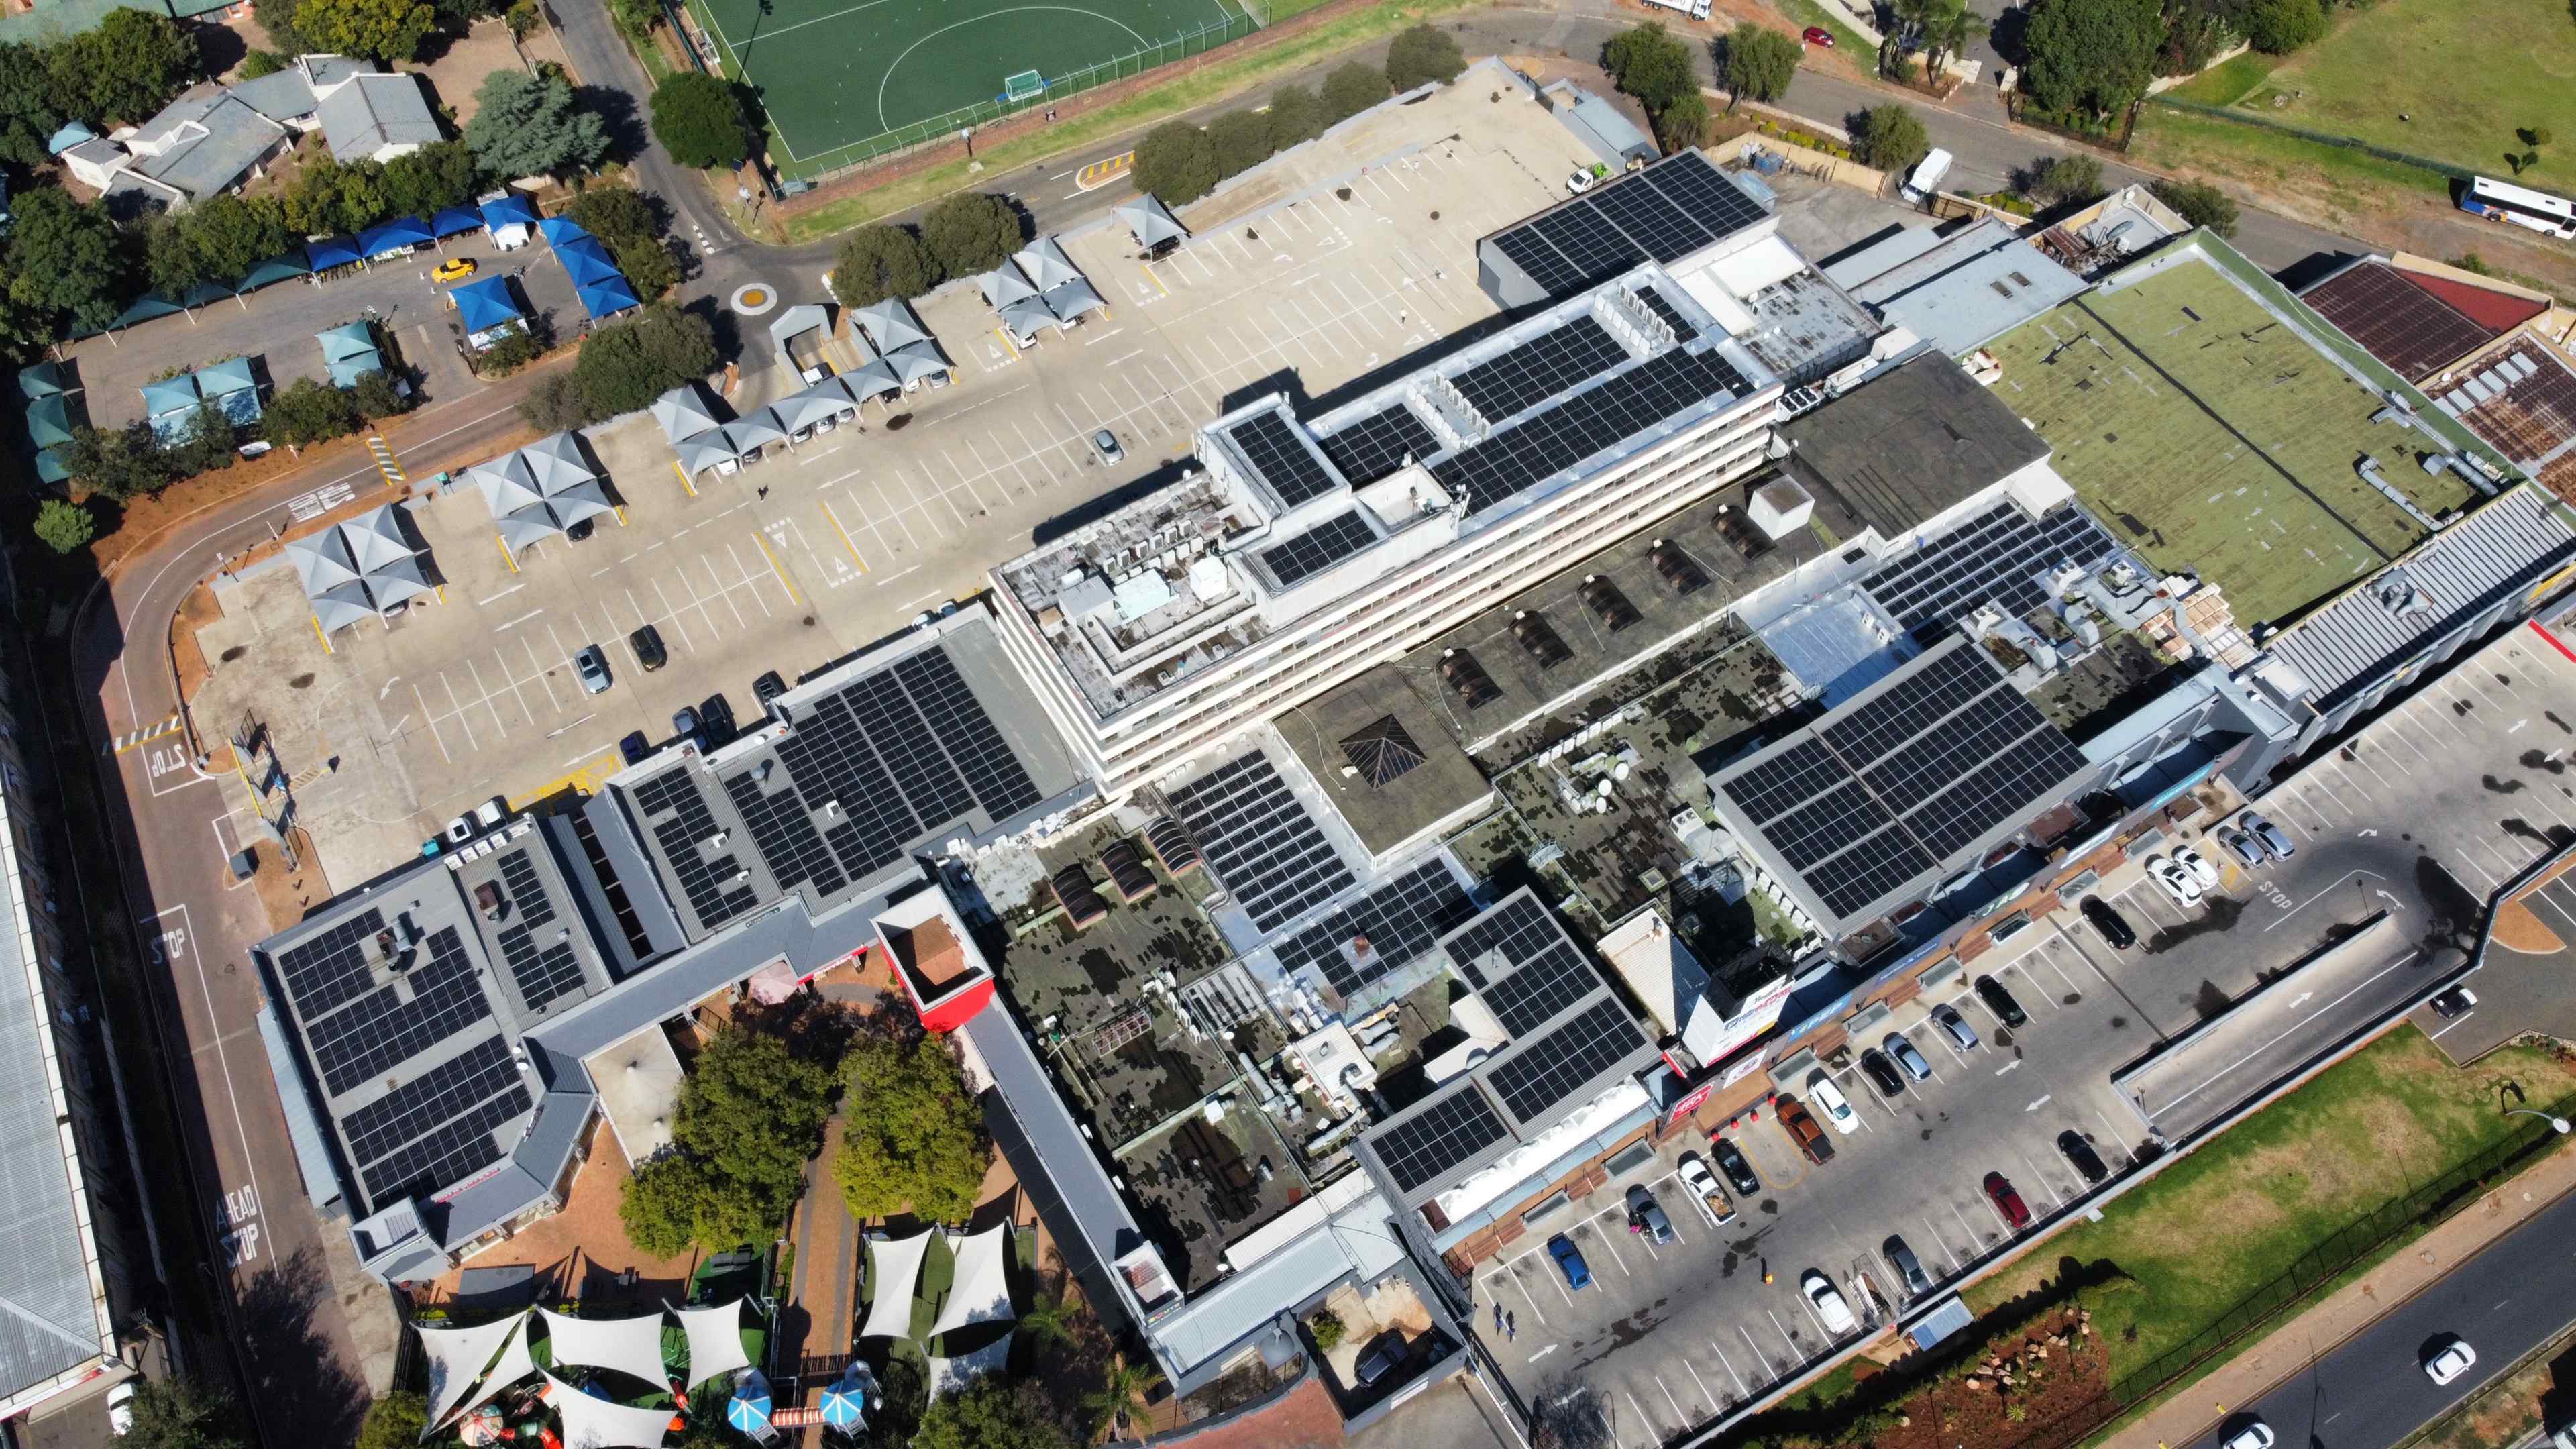
Solar on this tariff: the same daytime displacement as the LV scale at 11 kV rates, up to R6.9684 in winter peak. On sites this size the fixed and demand lines are large in rand terms, so the honest case is built on the energy the system actually serves, from half-hourly interval data. We operate a 778 kWp plant on this scale at Hermanstad Industrial Park.
When are Tshwane’s peak hours?

PeakStandardOff-peak

Typical solar generation window (about 07:00–17:00)

Winter (June–August)

Weekdays · Public holidays are billed as the actual day of the week

Off-peak
Standard
Peak
06:0008:0017:0020:0022:00

Peak 06:00–08:00, 17:00–20:00 · Standard 08:00–17:00, 20:00–22:00 · Off-peak 00:00–06:00, 22:00–24:00

Saturdays

Off-peak
Standard
Off-peak
Off-peak
07:0012:0017:0019:00

Standard 07:00–12:00, 17:00–19:00 · Off-peak 00:00–07:00, 12:00–17:00, 19:00–24:00

Sundays

Off-peak
Off-peak
17:0019:00

Standard 17:00–19:00 · Off-peak 00:00–17:00, 19:00–24:00

Summer (September–May)

Weekdays · Public holidays are billed as the actual day of the week

Off-peak
Standard
Peak
06:0007:0009:0018:0021:0022:00

Peak 07:00–09:00, 18:00–21:00 · Standard 06:00–07:00, 09:00–18:00, 21:00–22:00 · Off-peak 00:00–06:00, 22:00–24:00

Saturdays

Off-peak
Standard
Off-peak
Off-peak
07:0012:0018:0020:00

Standard 07:00–12:00, 18:00–20:00 · Off-peak 00:00–07:00, 12:00–18:00, 20:00–24:00

Sundays

Off-peak
Off-peak
18:0020:00

Standard 18:00–20:00 · Off-peak 00:00–18:00, 20:00–24:00

00:0006:0012:0018:0024:00
Tshwane’s schedule defers to the Eskom Municflex time-of-use definitions, so the windows move with the season. Uniquely in Gauteng, every public holiday is billed as the actual day of the week: a holiday Tuesday still carries weekday peak rates. Times are South African Standard Time.
Peak R/kWhStandard R/kWhOff-peak R/kWhSolar generation (kVA)

Winter weekday (Jun–Aug)

R0R2R4R6R8R1.5705R6.9919R2.7431Solar outputkVA00:0006:0012:0018:0024:00

Summer weekday (Sep–May)

R0R2R4R6R8R1.3092R2.8673R1.8526Solar outputkVA00:0006:0012:0018:0024:00
What a weekday costs hour by hour on the LV time-of-use scale (left axis, R/kWh ex VAT, same scale both seasons), with the shape of a clear day’s solar generation over it (right axis, kVA, unscaled because the curve’s height depends on system size). The windows move between panels: winter’s morning peak starts at 06:00, before solar; summer’s at 07:00, inside it.

Three things follow. First, winter peak exposure in Tshwane is concentrated at 06:00 to 08:00 and 17:00 to 20:00, mostly outside solar hours: managing it is a storage and load question. Second, the summer clock is generous to solar: the 07:00 to 09:00 peak and the whole standard day sit inside generation hours, nine months of the year. Third, the holiday rule cuts the other way from its neighbours: public holidays keep weekday pricing, so a system generating on a holiday earns full weekday value.

Solar and the rest of the bill

What solar does to each tariff’s energy lines is under that tariff above. Three questions cut across all of them: demand, power factor, and what stays.

Does solar reduce my demand charges?

Sometimes, and never dependably. Tshwane bills the month’s single highest half-hour in any period, including evenings and the pre-dawn winter peak, so the benefit only exists while solar happens to be generating at that exact moment; one cloudy afternoon or a tripped system restores the full peak. The 30 kVA and 140 kVA minimums also cap how far the line can fall. Across our operating fleet solar typically reduces billed demand by around 10%, with a site-to-site range of roughly 5 to 25%, and our rule in feasibility work is firm: never count demand reduction in the business case. Where the demand line is the target, peak shaving with batteries and load management reaches peaks solar cannot, sized from your half-hourly interval data.

Power factor: no reactive charge in Tshwane

Unlike City Power and Ekurhuleni, no Tshwane business scale bills reactive energy: there is no kVArh line to appear after a solar installation. The supply by-laws still oblige a customer to correct a poor power factor, and it still matters indirectly, because demand is billed in kVA: reactive power inflates the kVA your site registers, and a modern inverter, correctly installed, configured and programmed, compensates reactive energy and can trim the demand line from the ratio side. That is a commissioning setting, not an accessory purchase.

What solar does not change

The fixed monthly charges, the largest of Gauteng’s three metro utilities (R19,055.98 on the LV scale, R27,226.11 per metering point at 11 kV), the demand minimums, and any peak set outside generation hours. Tshwane levies no network surcharge and no percentage account surcharge, so everything billed per kWh moves fully with solar. An honest proposal models your interval data against these exact rates rather than quoting a percentage saving.

Can you sell power back to Tshwane?

On paper, yes: the book publishes an export credit of about 94c/kWh for excess energy transferred to the grid by a registered embedded generator, and non-domestic customers stay on their normal tariff with no extra availability charge. But the credit applies, in the schedule’s own words, only after approval by the City of Tshwane, and in our experience that approval and follow-through rarely materialises for commercial sites.

Our advice is the same as across the province: never build a business case on export revenue. Assume exported energy is worth zero until the city has demonstrated otherwise on your own account, and design for self-consumption first, where the saving is real, measurable and under your control.

How much do Tshwane tariffs increase each year?

Tshwane is the most predictable biller in Gauteng: it moves every line of the book by one flat percentage. 10.20% in 2025/26, 8.80% in 2026/27, applied identically to energy, demand and fixed charges. The panels track the 11 kV time-of-use scale across the last three books.

Winter peak energy

R/kWh, ex VAT (11 kV TOU)

R5.81
R6.97
'24/25'25/26'26/27

+19.9% over two years

Demand charge

R/kVA/month, ex VAT (11 kV TOU)

R309
R371
'24/25'25/26'26/27

+19.9% over two years

Fixed charge

R/month per metering point (11 kV TOU)

R22,708
R27,226
'24/25'25/26'26/27

+19.9% over two years

2024/25 and 2025/26 are gazetted figures; 2026/27 is the gazetted 2025/26 book escalated by the promulgated 8.80% increase (see the sources note). Because the increase is flat, every line shows the same cumulative change.

What that means for a solar decision. Nearly 20% in two years, compounding on every line, and because the whole book moves together, the mix never rescues you: fixed, demand and energy all climb in step. Every year of delay reprices the daytime energy a system would have served by roughly 9 to 10% more, and a case modelled on your own interval data against these rates simply improves each July.

Common questions

What are the Tshwane electricity tariffs for 2026/27?

Tshwane raised every line of its tariff book by 8.80% on 1 July 2026. For businesses, ex VAT: small premises up to 150 A pay a flat energy rate of about R3.23/kWh plus a fixed monthly charge set by amperage; low-voltage sites with an average load above 50 kVA sit on the LV time-of-use demand scale (winter peak R6.99/kWh down to summer off-peak R1.31/kWh, plus R373.21/kVA demand and a R19,056 monthly fixed charge); and 11 kV sites use the 11 kV time-of-use scale (winter peak R6.97/kWh, demand R370.66/kVA, fixed R27,226 per metering point). Figures are the gazetted 2025/26 schedule escalated by the promulgated 8.80% increase.

What are Tshwane's peak hours?

Tshwane follows the Eskom Municflex clock, so the windows move with the season: winter weekday peaks run 06:00 to 08:00 and 17:00 to 20:00; summer weekday peaks run 07:00 to 09:00 and 18:00 to 21:00. Saturdays and Sundays have no peak window. Uniquely in Gauteng, every public holiday is billed as the actual day of the week, so a holiday Tuesday still carries weekday peak rates.

How is demand billed in Tshwane?

On the half-hourly maximum demand of the month, in all periods including off-peak, at about R373/kVA on the LV scale and R371/kVA at 11 kV (2026/27, ex VAT). Minimum billed demand is 30 kVA on the LV scales and 140 kVA at 11 kV. When readings are unavailable, the city bills 60% (LV) or 70% (11 kV) of the highest demand of the preceding three months; unlike City Power there is no standing 80%-of-history floor, so with working metering a quiet month is billed on its own maximum.

Can solar reduce demand charges in Tshwane?

Sometimes, and never dependably. The demand charge bills the month's single highest half-hour in any period, including evenings and, in winter, an 06:00 to 08:00 peak that starts before solar does. One cloudy afternoon or a tripped system restores the full peak. Across our operating fleet solar typically reduces billed demand by around 10% (range roughly 5 to 25%); never count demand reduction in a feasibility case.

Does Tshwane pay for exported solar power?

The book publishes an export credit of about 94c/kWh (2026/27), but it applies only after approval by the City of Tshwane, and in our experience that approval rarely materialises for commercial sites. Never build a business case on export revenue: assume exported energy is worth zero until the city has demonstrated otherwise on your own account, and design for self-consumption first.

Is there a power-factor or reactive energy charge in Tshwane?

No. Unlike City Power and Ekurhuleni, no Tshwane business scale bills reactive energy. The supply by-laws still oblige you to correct a poor power factor, and a modern solar inverter, correctly configured, will typically improve it, but there is no kVArh line on the bill.

How do Tshwane's business tariffs compare with City Power and Ekurhuleni?

Tshwane is the most predictable of Gauteng's three metro utilities (every line moves by one flat percentage, 8.80% in 2026/27) and the only one with no reactive-energy charge, but it carries the highest fixed charges of the three (about R19,056 a month on the LV time-of-use scale and R27,226 per metering point at 11 kV). Its LV winter peak of R6.99/kWh sits below City Power's R7.66 and far below Ekurhuleni's R11.85, while City Power adds surcharges Tshwane does not levy and Ekurhuleni pays a real export credit. The structures differ enough that a solar case must be modelled against the actual schedule, never a Gauteng average.

Are the 2026/27 figures on this page official?

They are the gazetted 2025/26 schedule (Gauteng Provincial Gazette 217, LAN 648) escalated by the city's promulgated 8.80% increase for 2026/27, the flat-percentage method Tshwane has applied to every line of the book in each of the last two years. The city had not yet published the consolidated 2026/27 electricity gazette when this page was last updated; we will replace the derived figures with the gazetted ones when it appears.

Sources. Base rates are the City of Tshwane’s gazetted 2025/26 tariff schedule (Gauteng Provincial Gazette 217 Vol 31, 18 June 2025, LAN 648, Schedule 2), quoted ex VAT. The 2026/27 figures shown are those gazetted rates escalated by the city’s promulgated 8.80% increase for 2026/27, the flat-percentage method Tshwane has applied to every line in each of the last two years, cross-checked against third-party republications of the 2026/27 rates. The city had not yet published its consolidated 2026/27 electricity gazette when this page was last updated; we will replace the derived figures the day it appears. We maintain these schedules in the tariff engine behind our monitoring platform and verify them against metered fleet data and actual invoices.

Your tariff decides what solar is worth.

Send us your monthly usage and tariff, and we'll model your site against the actual Tshwane rates on this page, not an assumed average.