Finance
Is solar still worth it for a business in Gauteng? What comes off the bill in 2026/27, and what stays
By Jonathan de Vrye, BSc Eng — Managing Director · Updated 17 October 2026 · Rates checked on 4 September 2026
Yes: on the tariffs most Gauteng businesses buy on, a unit of grid electricity averages R2.02 to R4.88 per kWh across the year, excluding VAT, in 2026/27 (Table 1), and the daytime units that solar replaces on City Power’s three business tariffs average R2.81 to R4.88 (Table 2). A unit of rooftop solar costs about R1.25 under a power purchase agreement and about R0.97 over the life of a system you own. Against City Power’s tariffs that is a saving of 56 to 74% on every replaced unit under a PPA and 66 to 80% if you own the system (Table 2), and the gap widens with every July increase.
The limit is coverage, not price. A grid-tied system without batteries replaces only the units used while the sun is up, typically 30 to 50% of a site’s municipal kWh. The rest is consumed at night and on weekends, and only batteries can move daytime energy into those hours. Solar also leaves the fixed and demand charges untouched, so the bill after solar is smaller, not gone. The return on the units it does replace is still very good, and the numbers below are the 2026/27 schedules, not estimates.
What does a business kWh cost in Gauteng in 2026/27?
The energy charge alone, ex VAT, from our verified references for City Power, Ekurhuleni and Tshwane. City Power figures include its 6c/kWh network surcharge and 2% account surcharge; the other two metros have neither. Winter is June to August.
Table 1. Energy charge per kWh, 2026/27, ex VAT
| Metro and tariff | Who it serves | Summer | Winter | Average R/kWh (year) |
|---|---|---|---|---|
| City Power, Business tariff, top block | Up to 100 kVA, more than 3,000 kWh a month | R4.84 | R4.98 | R4.88 |
| City Power, Large Power User demand tariff (flat) | 70 to 1,000 kVA at 400 V | R2.97 | R3.47 | R3.09 |
| City Power, Large Power User time-of-use, LV | 70 to 1,000 kVA at 400 V | Peak R3.35 · Standard R2.53 · Off-peak R1.96 | Peak R7.88 · Standard R3.05 · Off-peak R2.11 | R2.62 |
| Ekurhuleni, Tariff E, LV | Above 25 kVA, below 1 MVA | Peak R3.88 · Standard R2.55 · Off-peak R1.95 | Peak R11.85 · Standard R3.46 · Off-peak R2.14 | R2.87 |
| Ekurhuleni, Tariff A | Up to 80 A per phase | R4.46 | R4.46 | R4.46 |
| Tshwane, LV time-of-use demand scale | Average load above 50 kVA | Peak R2.87 · Standard R1.85 · Off-peak R1.31 | Peak R6.99 · Standard R2.74 · Off-peak R1.57 | R2.02 |
| Tshwane, small business up to 150 A | Flat | R3.23 | R3.23 | R3.23 |
The average column is the energy rate across the year for a flat load, the same kWh every hour, with nine summer and three winter months. On the time-of-use tariffs it is averaged over each metro’s clock, which on all three works out to 25 peak, 64 standard and 79 off-peak hours a week. Tshwane’s figures are the gazetted 2025/26 rates escalated by the promulgated 8.80%, pending the 2026/27 gazette. Ekurhuleni’s are the NERSA-approved schedule the city implemented on 1 July 2026 and has taken on review.
Table 1 and its average column cover the energy charge only. Fixed monthly charges and kVA demand charges sit on top of it, and solar does not change them. The full breakdowns are on the City Power, Ekurhuleni and Tshwane tariff pages.
What is a solar kWh worth, and what does one cost?
A solar unit used on site is worth the full energy rate of the hour it replaces, surcharges included. Rooftop systems generate between about 07:00 and 18:00, so that is a peak or standard rate, never an off-peak one.
The solar blended tariff is the average of those hourly rates weighted by when a rooftop system produces: what City Power charges, per kWh, for the units solar replaces. On the time-of-use tariff it is R2.81 across the year (R3.07 for a weekday-only site), above the R2.62 average unit in Table 1; on the flat tariffs it equals the flat rate. Solar itself costs about R1.25 per kWh under a PPA and about R0.97 over the life of an owned system.
Table 2. What City Power charges for the kWh solar replaces, against what solar costs per kWh, year one, ex VAT
| Tariff | City Power’s blended solar tariff | Solar under a PPA | Solar you own (LCOE) | Saving under the PPA | Saving if owned |
|---|---|---|---|---|---|
| Business tariff, top block | R4.88 | R1.25 | R0.97 | 74% | 80% |
| Large Power User demand (flat) | R3.09 | R1.25 | R0.97 | 60% | 69% |
| Large Power User time-of-use, LV | R2.81 R3.07 weekday-only | R1.25 | R0.97 | 56% 59% weekday-only | 66% 68% weekday-only |
Table 3. Owning the system: simple payback and year-one return per tariff, on our published budget figures, ex VAT
| Tariff | Solar blended tariff | Representative system | Simple payback | Year-one return |
|---|---|---|---|---|
| Business tariff, top block | R4.88 | 50 kWp at R10,400/kWp | 1.6 years | 68% |
| Large Power User demand (flat) | R3.09 | 200 kWp at R7,850/kWp | 1.9 years | 57% |
| Large Power User time-of-use, LV | R2.81 R3.07 weekday-only | 200 kWp at R7,850/kWp | 2.1 years 1.9 years weekday-only | 52% 57% weekday-only |
The gap widens every year: the grid rate is reset by NERSA (9.01% in July 2026, 8.84% approved for 2027), the PPA rate escalates on the terms in the agreement, and an owned system’s cost per unit is fixed the day it is built. A unit from your own roof is the cheapest unit a business in Gauteng can buy, and the only one whose price is not set by a regulator.
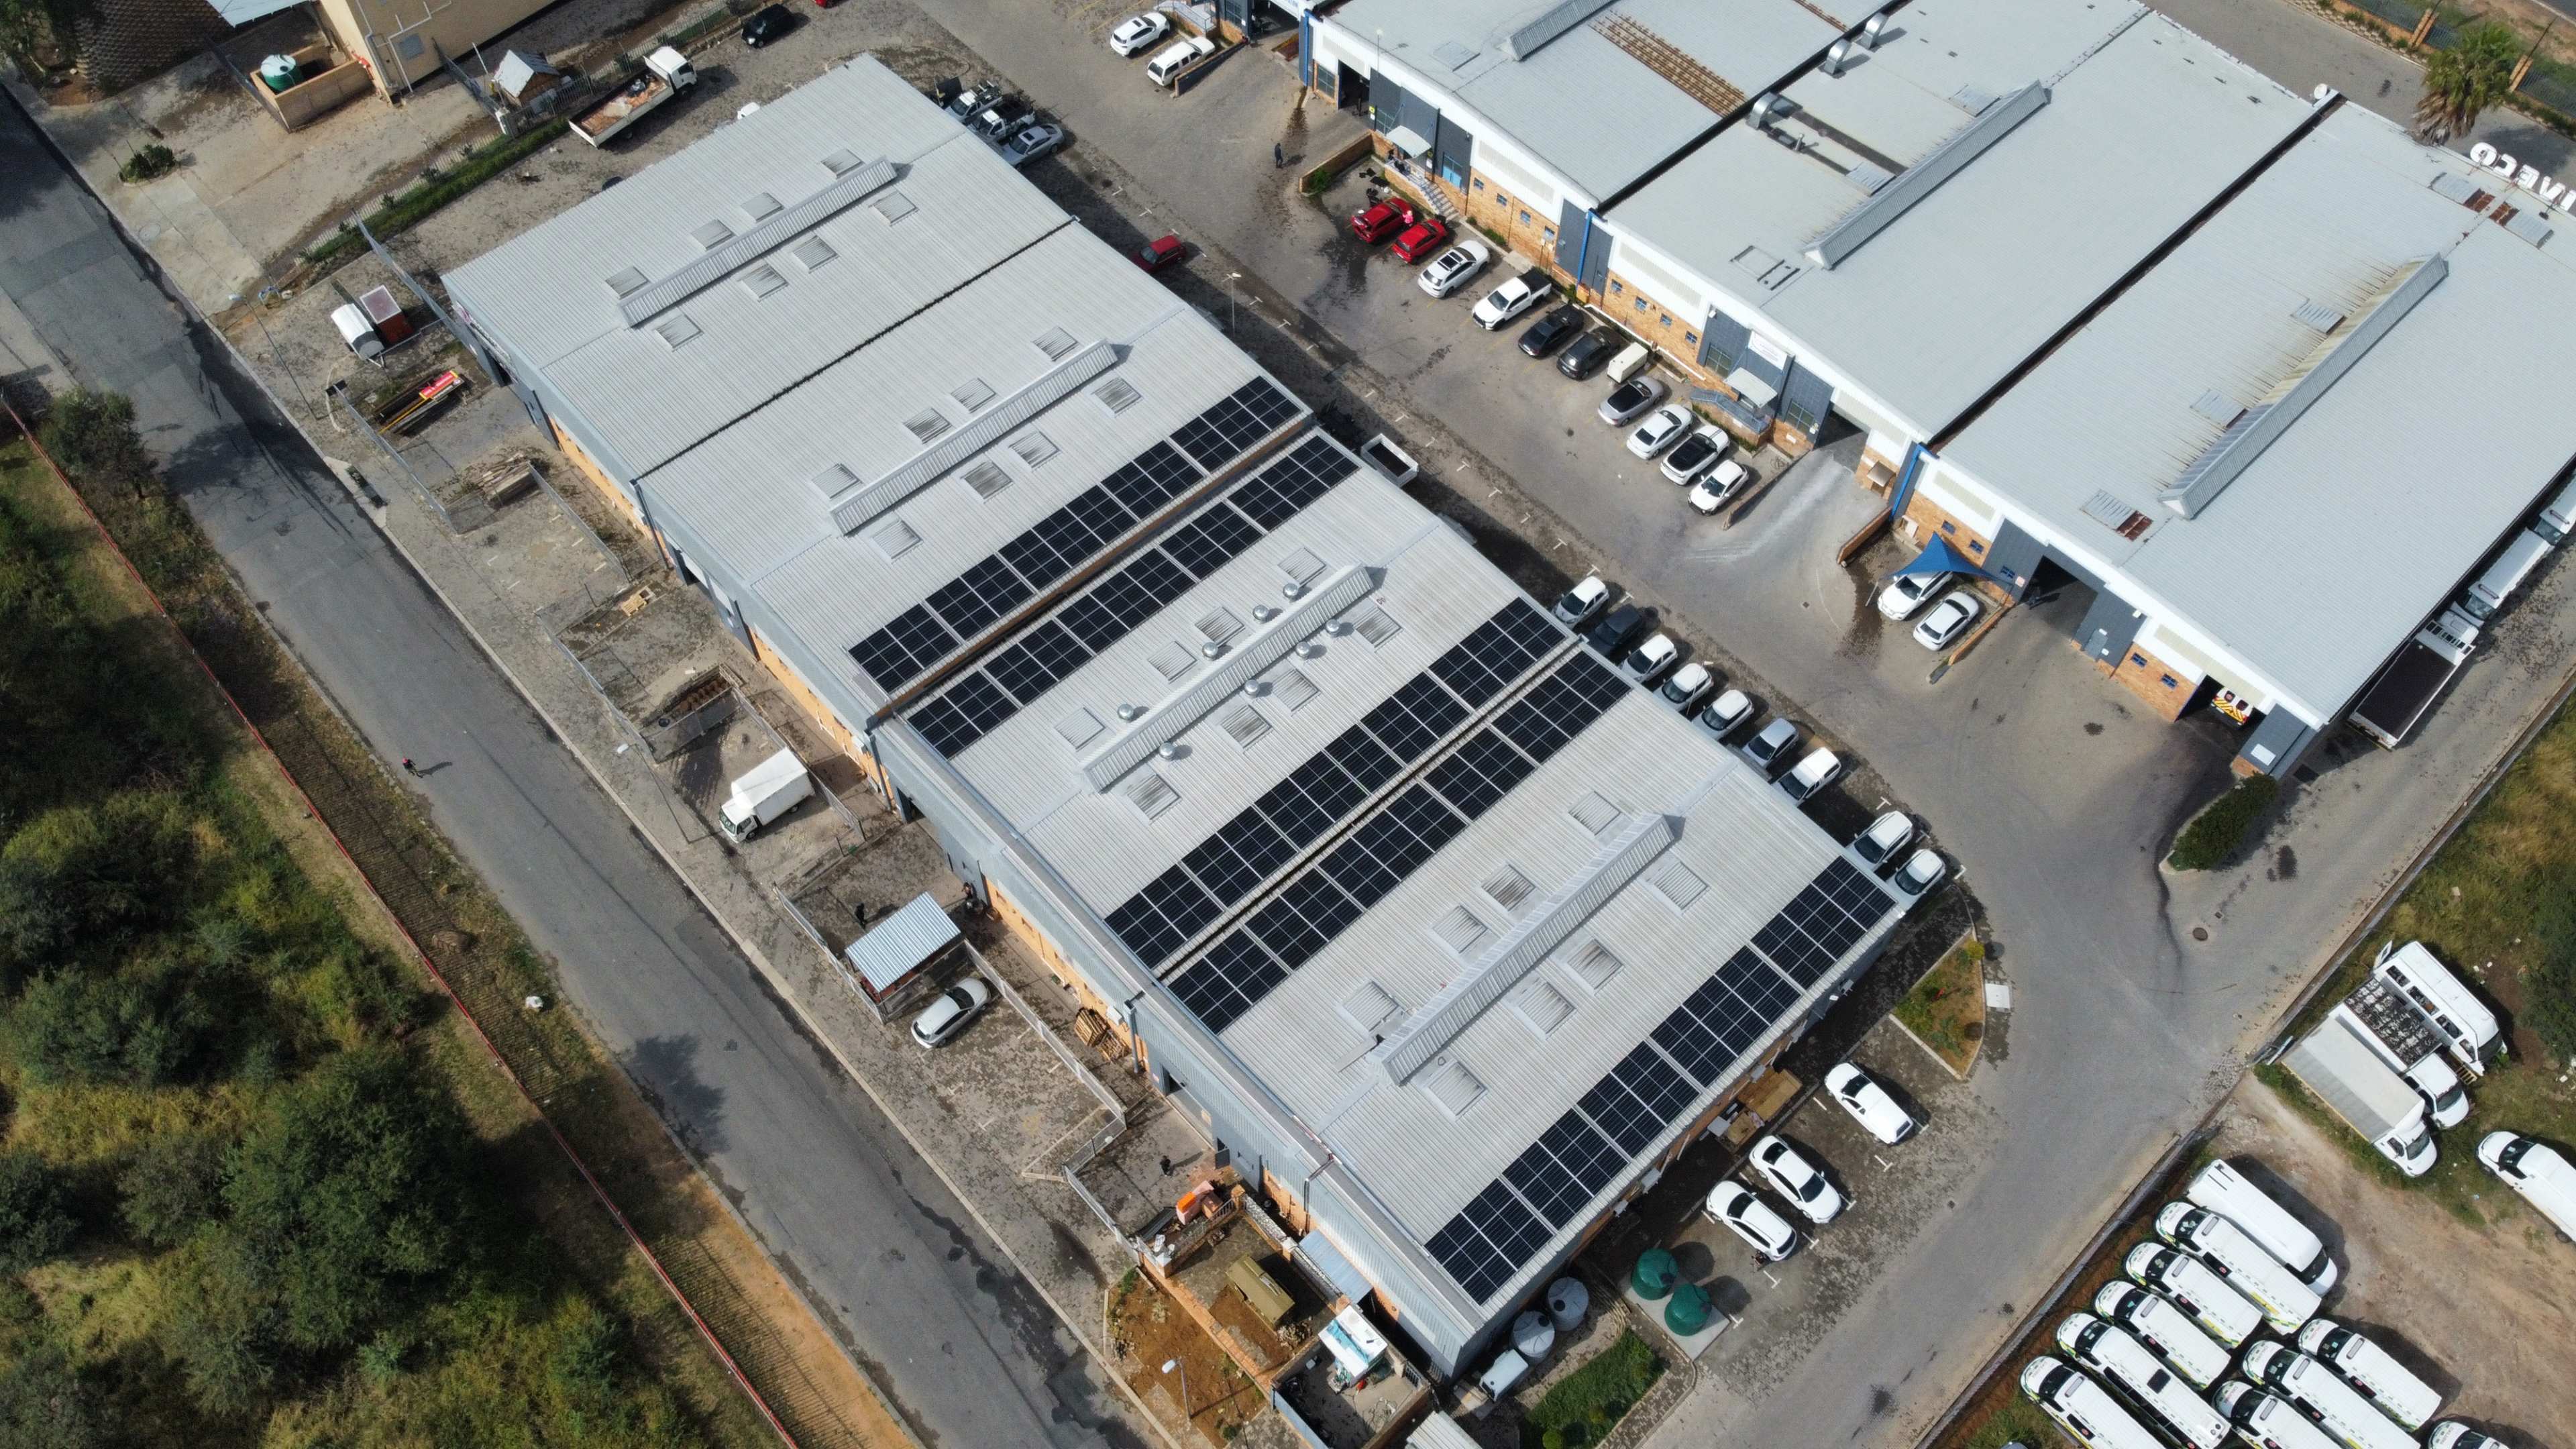
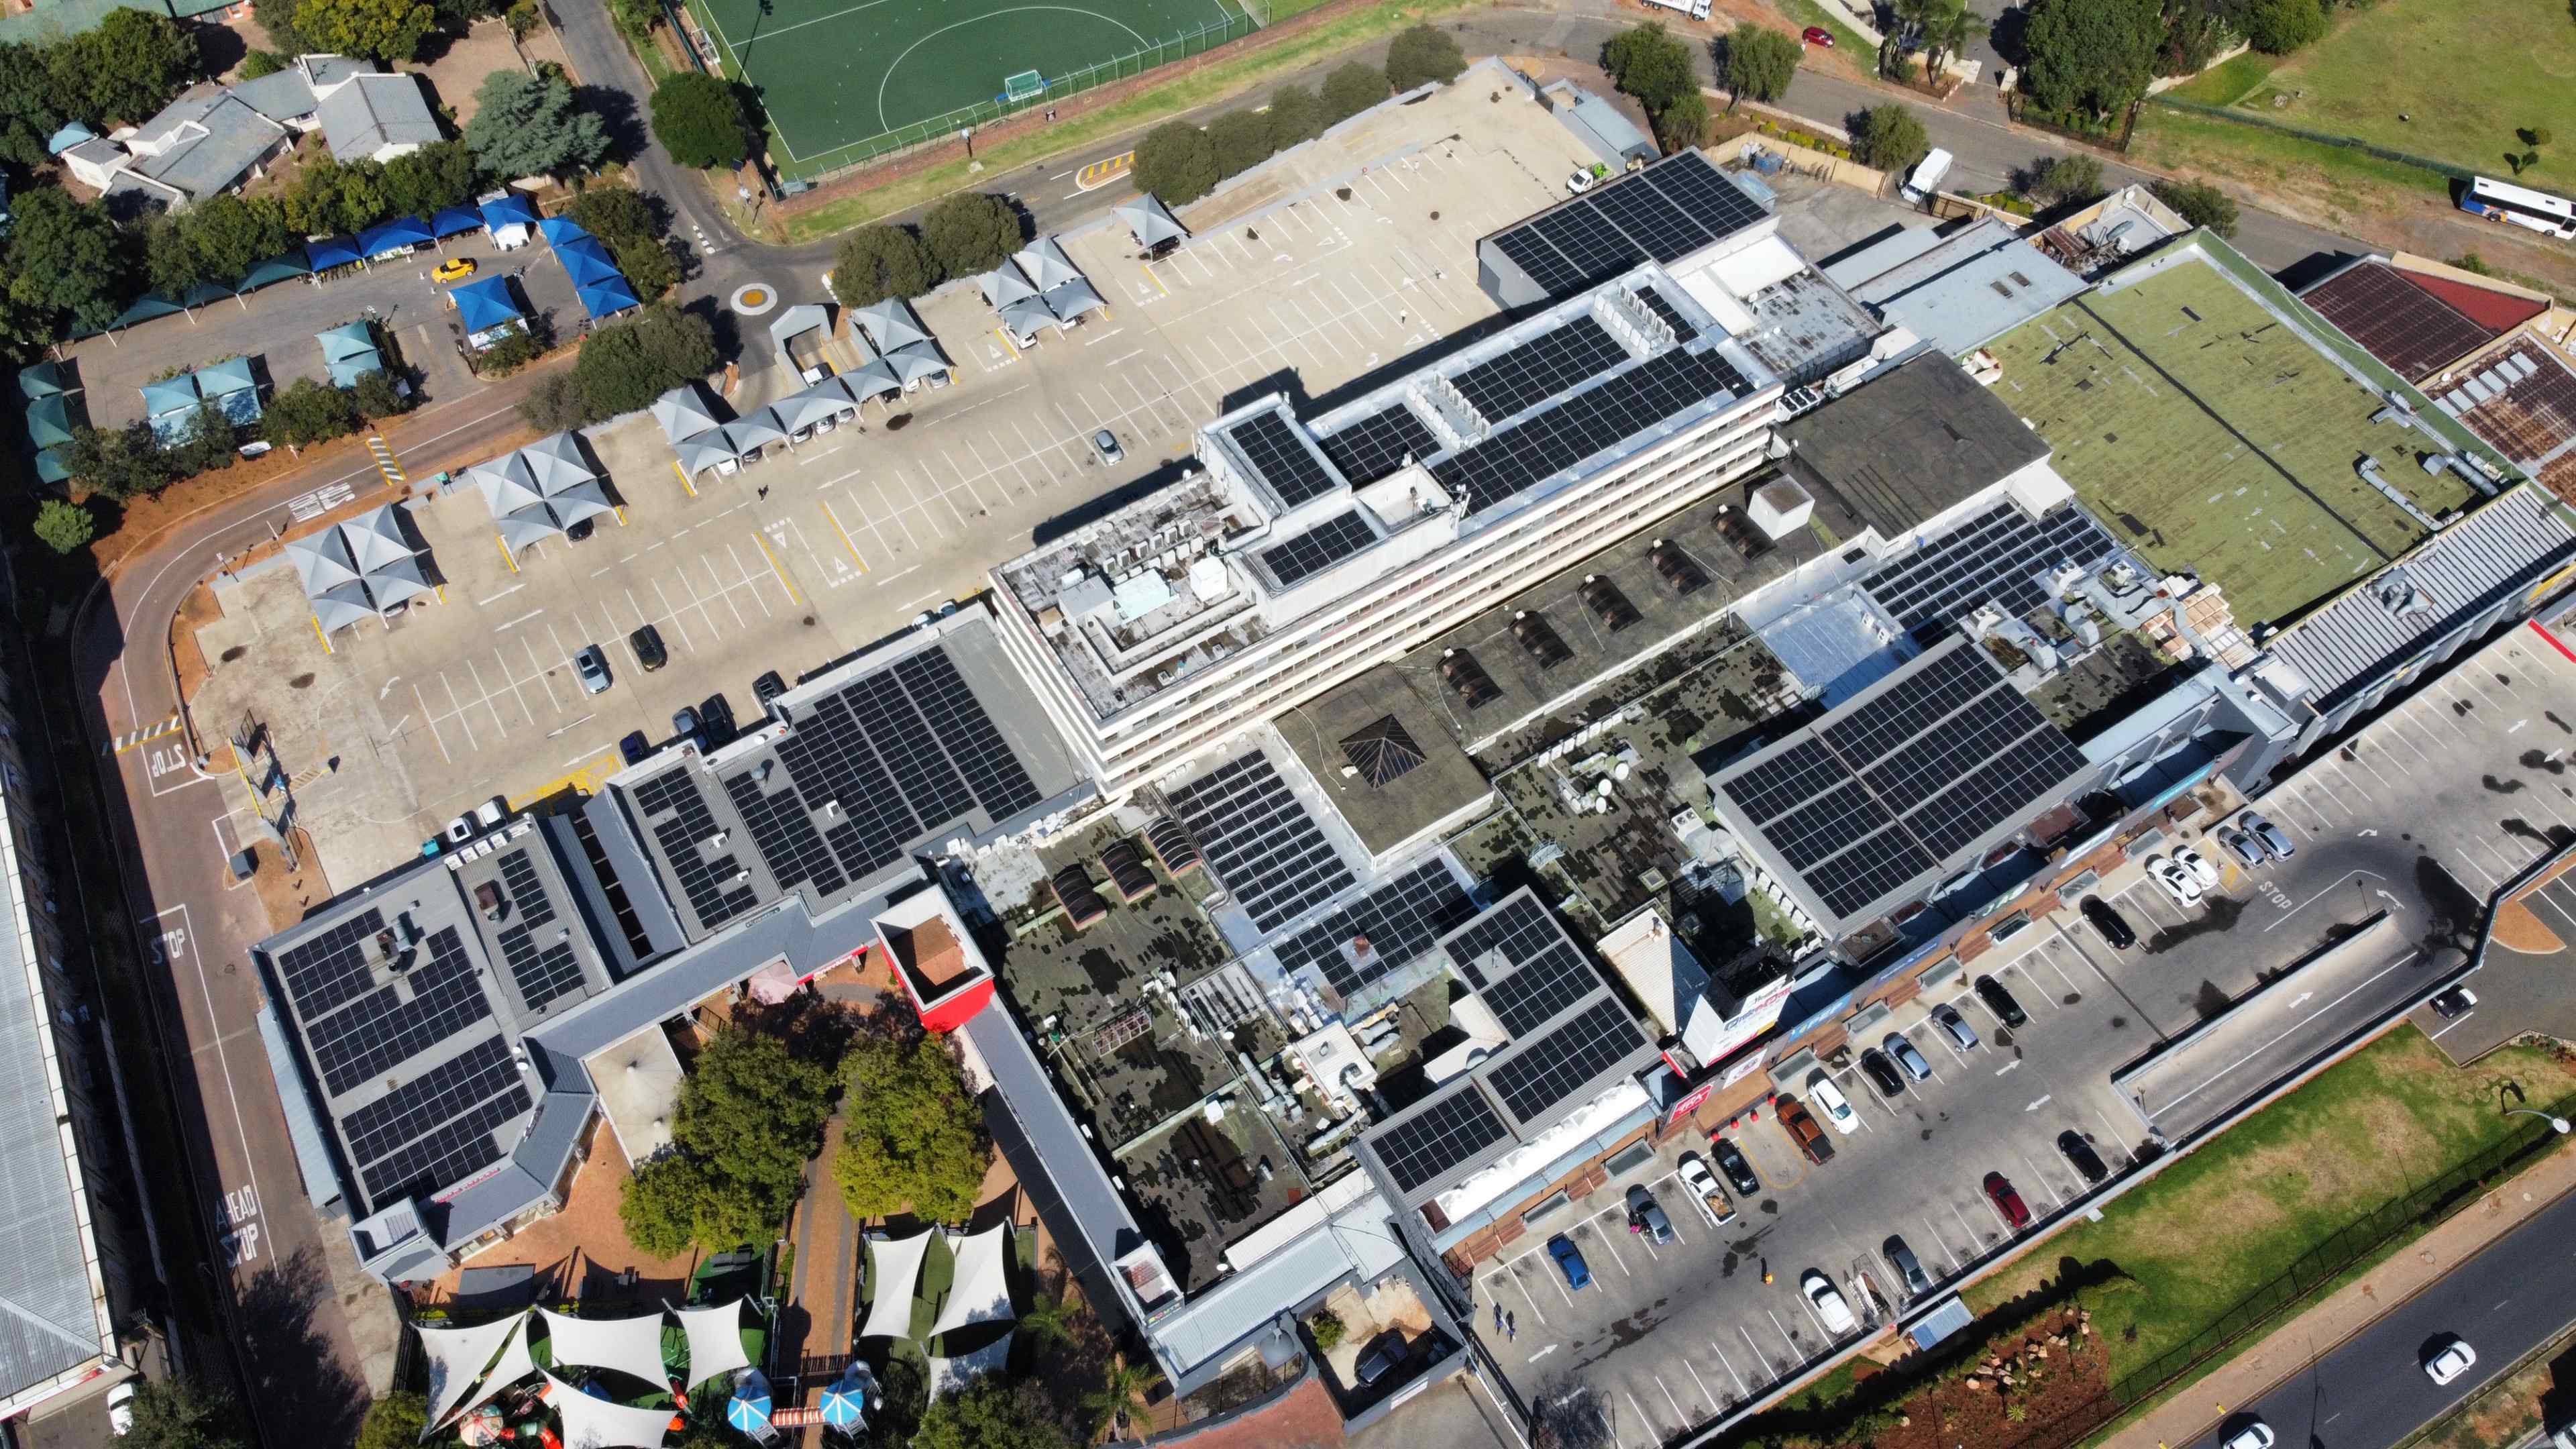
Three of our published Johannesburg projects show systems of this kind on real roofs: Kimbult Industrial Park at 547 kWp, Hillcrest Retail Centre at 145 kWp and Canero Office Park at 124 kWp.
Solar blended tariff: City Power’s 2026/27 energy rate, surcharges included, weighted by a Johannesburg rooftop’s hourly output from sun geometry across the seven-day clock, equal monthly production, nine summer and three winter months; energy charges only. PPA rate: the illustrative R1.25/kWh in the labelled example on our finance page; actual rates and escalation are set per site in the agreement. LCOE: our published budget figure of R7,850 per kWp ex VAT for a 200 kWp grid-tied system without batteries, 1,450 kWh per kWp in year one, 0.5% annual degradation, running costs of 3.75% of capital a year rising 6%, 25 years, costs and energy both discounted at 10%; R0.80 to R1.07 across the 100 to 500 kWp bands and lower running costs; about R0.80 after the Section 12B deduction at 27%. Payback and return: all solar energy consumed on site at the solar blended tariff, 1,450 kWh per kWp in year one, the published budget band for the representative size, running costs 3.75% of capital; payback = capital divided by the year-one saving less running costs; return = year-one saving divided by capital, before tax and before the Section 12B deduction. A design-stage illustration, not a quote.
Can I sell the extra solar power back to the grid?
Plan as if you cannot, and size the system for self-consumption. City Power currently requires zero export until its feed-in process exists. Tshwane pays its credit only after City approval. Ekurhuleni pays R1.05 to R1.53 per kWh to registered net consumers with a four-quadrant meter, well below the import rate. We count exported energy as zero in every business case.
How much of the bill can solar remove?
- Energy line: typically 30 to 50% of the site’s kWh without batteries, across the systems we operate. Daytime, weekday operations sit at the top of the range; 24-hour and evening-heavy operations at the bottom. Night and weekend units stay on the grid.
- Demand line: solar lowers it on many sites, typically by about 10% across our fleet (5 to 25%), and we never count it. One cloudy afternoon or a tripped inverter restores the peak, and City Power’s floor holds it for a year.
- Fixed lines: unchanged. In Johannesburg a prepaid business must move to conventional billing to register a generator, which adds monthly service and capacity charges.
The whole-bill saving is therefore always a smaller percentage than the kWh saving. A worked example: a 200 kWp system on City Power’s Large Power User demand tariff at a site using 60,000 kWh a month with 250 kVA billed demand, in a summer month. The system supplies about 24,167 kWh, all used on site, 40% of the units.
Table 4. A 200 kWp system on City Power’s LPU demand tariff: one summer month before and after, ex VAT
| Line | Before solar | After, system owned | After, under a PPA |
|---|---|---|---|
| Grid energy at R2.97/kWh (60,000 kWh, then 35,833 kWh) | R178,068 | R106,346 | R106,346 |
| Solar energy under the PPA (24,167 kWh at R1.25) | – | – | R30,208 |
| Demand (250 kVA at R461.22) | R115,305 | R115,305 | R115,305 |
| Service and capacity | R3,861 | R3,861 | R3,861 |
| Total for the month | R297,233 | R225,512 | R255,720 |
| Difference | R71,722 (24.1%) | R41,513 (14.0%) |
Solar took 40% of the units off the bill and the bill fell by 24.1% owned, or 14.0% under the PPA once the solar units are paid for, because the demand line and the night-time units did not move. The owned saving is what the capital in Table 3 buys; winter runs the same way at the higher winter rate.
Inputs are illustrative: 60,000 kWh a month, 250 kVA billed demand, production of 1,450 kWh per kWp a year spread evenly over twelve months, every solar unit consumed on site, the demand charge unchanged, and the PPA at the finance page’s illustrative R1.25/kWh. Rates are the 2026/27 schedule with surcharges; totals are computed from the unrounded rates.
Why is the bill still high after solar?
- Night and weekend units are untouched.
- The demand charge did not move, and Johannesburg’s 80% floor remembers last year’s peaks.
- The 9.01% July increase landed on the remaining units and the fixed lines in the same year.
- A prepaid account became a conventional one, with new service and capacity charges.
- A reactive-energy line appeared: City Power bills reactive energy above 30% of the month’s kWh when power factor is below 0.96, and solar cuts kWh without cutting reactive draw. A correctly configured inverter compensates it; check the configuration before buying correction equipment.
- The system is producing less than it should: dirt, shade, a failed string, a tripped inverter, or a zero-export setting discarding energy from a system sized beyond the daytime load. This one needs measurement against a weather-adjusted expectation, not explanation.
What do batteries change?
They move daytime energy into the evening and night, so the share of units solar replaces rises above 30 to 50%, and they can shave the demand peak dependably, which panels cannot. A stored unit costs more than a daytime solar unit, so a battery is sized for a specific job (a peak, a ride-through, or night supply) and priced against the line of the bill it targets.
Did the end of load shedding change the maths?
No. Eskom last implemented load shedding on 16 May 2025 and had run 441 days without it by 4 August 2026. A grid-tied system without batteries never generated during load shedding, because it must disconnect when the grid fails. The case was always the price of a daytime unit, and that price moved three ways in 2026:
- Eskom-direct customers paid 8.76% more from 1 April 2026, municipal customers 9.01% more from 1 July 2026, and NERSA has approved 8.83% (Eskom-direct) and 8.84% (municipal) from 1 April 2027. Stats SA’s producer price index put electricity at 8.3% year on year in July 2026 against 5.7% for manufactured goods.
- Fixed charges are growing by design. Eskom said on 31 August 2026 that it “will retain revenue through network charges, customer wheeling and revised tariff structures, which separate energy charges from the recovery of fixed costs.” Solar reaches the energy charge only.
- Equipment stopped getting cheaper. Chinese module prices rose more than 30% in early 2026 before settling.
What to do next
Gather twelve months of bills, or your interval meter data, and have the saving modelled against your actual tariff schedule, period by period. Ask for the kWh saving and the bill saving as two separate numbers, with the working.
Sources. City Power, Schedule of Approved Tariffs FY26/27 (1 July 2026) and City of Johannesburg council tariff books; City of Ekurhuleni, Schedule 2 of Electricity Tariffs 2026-27 aligned with NERSA rates approved 23 May 2026; Gauteng Provincial Gazette 217, LAN 648 (18 June 2025) escalated by Tshwane’s promulgated 8.80%; Focal Energy’s published budget figures (cost guide) and the labelled example inputs on the finance page; NERSA media statement, 10 March 2026; MyBroadband, 3 September 2026; SAnews, 4 August 2026; Statistics South Africa, PPI July 2026; BusinessTech, 31 August 2026; pv magazine, 26 January and 15 May 2026; SOLINK, 10 July 2026 (advisory, wheeled tariffs); City Power SSEG FAQ, 27 March 2025; CoJ Council item 76, 30–31 March 2026; Focal Energy operating experience across the systems it operates. All rates ex VAT, current for the 2026/27 tariff year, refreshed each July.
Common questions
Is solar still worth it for a business now that load shedding is over?
Yes: a grid-tied system never ran during load shedding. The case is a daytime unit at R2.02 to R11.85 ex VAT in 2026/27, rising 9.01% in July 2026 with 8.84% approved for 2027, against a solar unit at about R1.25 under a PPA or about R0.97 over the life of an owned system.
How much of my bill can solar remove?
Typically 30 to 50% of the kWh without batteries, and a smaller share of the bill, because demand and fixed charges are unchanged. In the worked example on this page, a 200 kWp system takes 40% of the units off a summer bill on City Power's demand tariff and the bill falls by 24.1% if the system is owned, or 14.0% once the solar units are paid for under a PPA.
Is solar cheaper than Eskom or municipal electricity?
Per unit, by a wide margin. On City Power's three business tariffs the units solar replaces cost R2.81 to R4.88 per kWh in 2026/27, against R1.25 under an illustrative PPA (56 to 74% less) and about R0.97 for an owned system (66 to 80% less). Compare on the energy portion of the bill, not the blended average.
Does solar reduce my demand (kVA) charge?
Sometimes, by about 10% across our fleet (5 to 25%), and never dependably. We do not count it. Batteries and load management are the tools when the demand line is the target.
Can I sell my extra solar power back?
Plan as if you cannot. City Power currently requires zero export; Tshwane pays only after City approval; Ekurhuleni pays R1.05 to R1.53 per kWh to registered net consumers with a four-quadrant meter, well below the import rate.
Why is my bill still high after installing solar?
Night and weekend units, an unchanged demand charge, fixed charges, the July increase, a switch to conventional billing, a new reactive-energy line, or a system producing less than it should. The last two need a configuration check and measurement.
See what your site could save.
Tell us your monthly electricity usage and we’ll model your consumption, system options and payback. Numbers you can rely on.